

The Australian Dollar is down nearly 2% off the monthly highs against the US Dollar with the decline testing the first major daily support zone early in the week. These are the updated targets and invalidation levels that matter on the AUD/USD charts. Review my latest Weekly Strategy Webinar for an in-depth breakdown of this Aussie[6] trade setup and more.[1][2][3][4][5]
New to Forex[7] Trading? Get started with this Free Beginners Guide[8]
Australian Dollar Price Chart – AUD/USD Daily

Chart Prepared by Michael Boutros, Technical Strategist; AUD/USD on Tradingview[9][10]
Technical Outlook: In my last Australian Dollar Price Outlook we noted that Aussie was testing near-term uptrend support while highlighting that, “Weakness beyond 6815 would suggest a larger correction is underway.” A downside break post-FOMC last week fueled a steeper decline in price with AUD[13]/USD[14] now testing key daily support at 6759/67 – a region defined by the 61.8% retracement of the September advance and the monthly low-day close.[11][12][15]
A break / close below this threshold is needed to keep the short-bias viable with such a scenario targeting the monthly open / pitchfork support at 6724. Key daily resistance now 6827 with a breach above the monthly high-day close at 6866 needed to suggest a more significant low was registered this month. [16]
Why does the average trader lose? Avoid these Mistakes in your trading[17]
Australian Dollar Price Chart – AUD/USD 120min
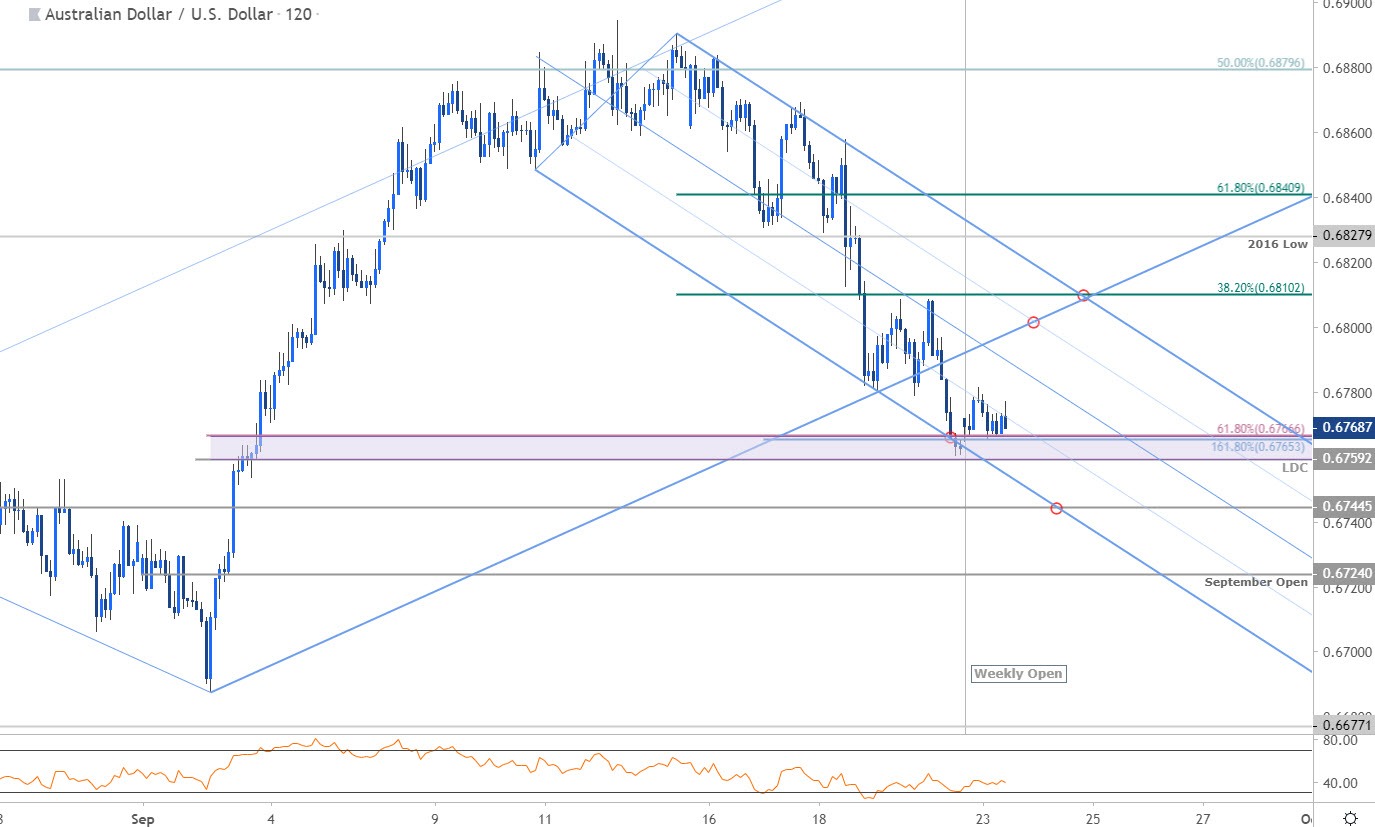
Chart Prepared
