

The Canadian Dollar is up down more-than 0.2% against the US Dollar since the start of the week with USD/CAD[3] stretching into near-term resistance post- FOMC yesterday. Despite the recent advance, Loonie remains within the confines of a well-defined range with the broader outlook still tilted to the downside. These are the updated targets and invalidation levels that matter on the USD/CAD weekly chart. Review my latest Weekly Strategy Webinar for an in-depth breakdown of this Euro[8] price setup and more.[1][2][4][5][6][7]
New to Forex[9] Trading? Get started with this Free Beginners Guide[10]
Canadian Dollar Price Chart – USD/CAD Weekly
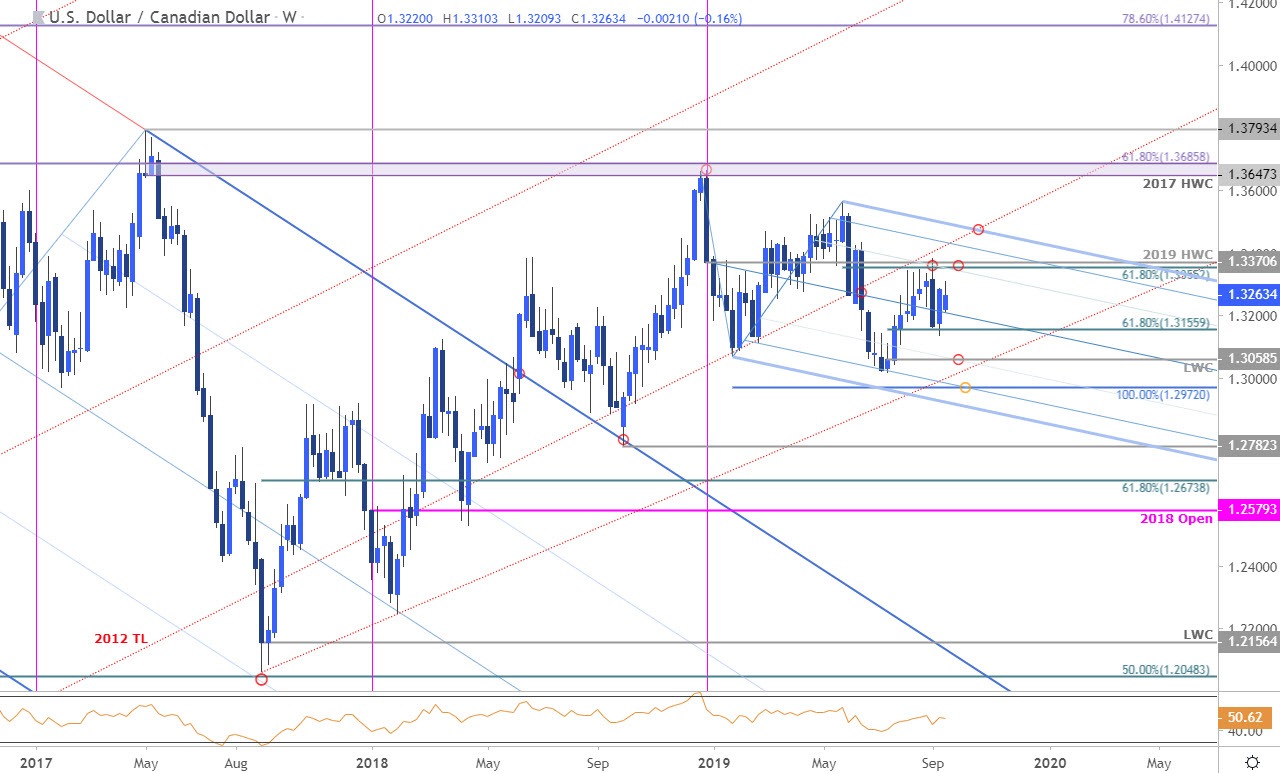
Chart Prepared by Michael Boutros, Technical Strategist; USD/CAD on Tradingview[11][12]
Notes: In my last Canadian Dollar Price Outlook we noted that USD[14]/CAD[15] was approaching daily resistance at, “1.3288- a close above this threshold is needed to keep the near-term long-bias viable.” A brief stint above pulled back with price closing precisely at 1.3288 on the heels of the FOMC. Note that USD/CAD continues to trade within the confines of the early September outside-weekly reversal range and the focus remains on a break of this zone for guidance with the broader risk lower while below key resistance at 1.3355/70- a region defined by the 61.8% retracement of the May decline.[13][16]
Initial support rests with the median-line of the descending pitchfork formation we’ve been tracking off the 2018 high with a break / close below 1.3155 needed
