

Gold Price Outlook:
The bullish trend in Gold continued at the start of this week as prices pushed up for another fresh six-year-high. Gold touched up to 1555 this week with Gold futures touching 1565 shortly after the weekly open. That early-week strength soon pulled back and prices found support ahead of the US open on Monday. That support held into Tuesday and buyers began to push again mid-week. Gold prices again touched the 1550 level in a brief fashion earlier this morning, pulling back after news of a softening in the ongoing US-China trade war began to take hold. [1]
Prices are now pulling below the bullish trend that held through Tuesday and Wednesday, with support potential remaining at the same 1527 level that came into play on Monday. [2]
Gold Price Hourly Chart
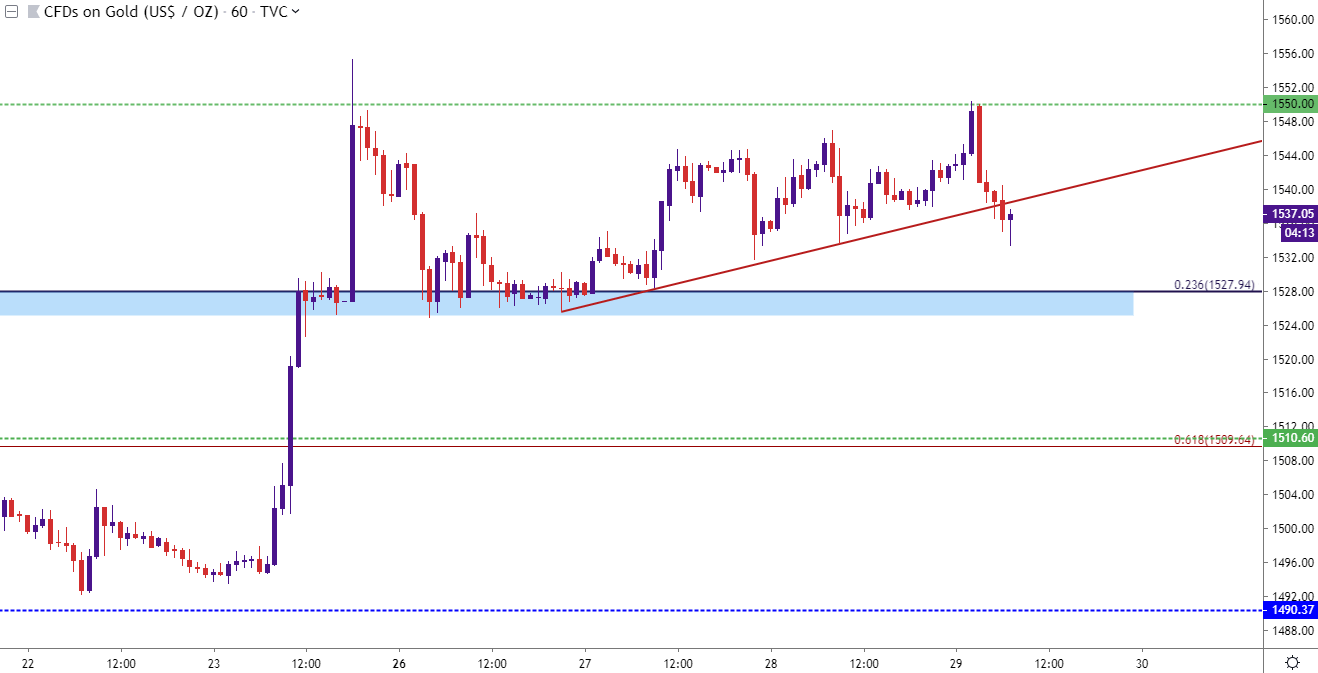
Chart prepared by James Stanley; Gold on Tradingview[3][4]
Taking a step back and there could be scope for a deeper pullback here, particularly considering the fundamental backdrop with a softening in the Trade War theme. That scenario helped to perk prices higher earlier this month on the announcement of fresh tariffs on China, and even as those tariffs were walked back bulls remained aggressive on the bid. [5]
But, at this point, RSI on the Daily has continued to diverge as resistance as held, and this goes along with the most overbought readings for that indicator on the weekly chart since 2011, right around the time that Gold prices topped-out above the 1900 level. [6]
Gold Price Daily Chart

Chart prepared by James Stanley; Gold on Tradingview[7][8]
Support Potential in Gold
Given the strength of the now three-month-old trend combined, short-side strategies
