

Silver prices[1] have surged nearly 30% of the May lows with the breakout now probing a critical resistance confluence at fresh two-year highs. These are the updated targets and invalidation levels that matter on the XAG/USD weekly price chart heading into the close of August trade. Review my latest Weekly Strategy Webinar for an in-depth breakdown of this Silver price setup and more.[2]
Silver Price Chart - XAG/USD Weekly
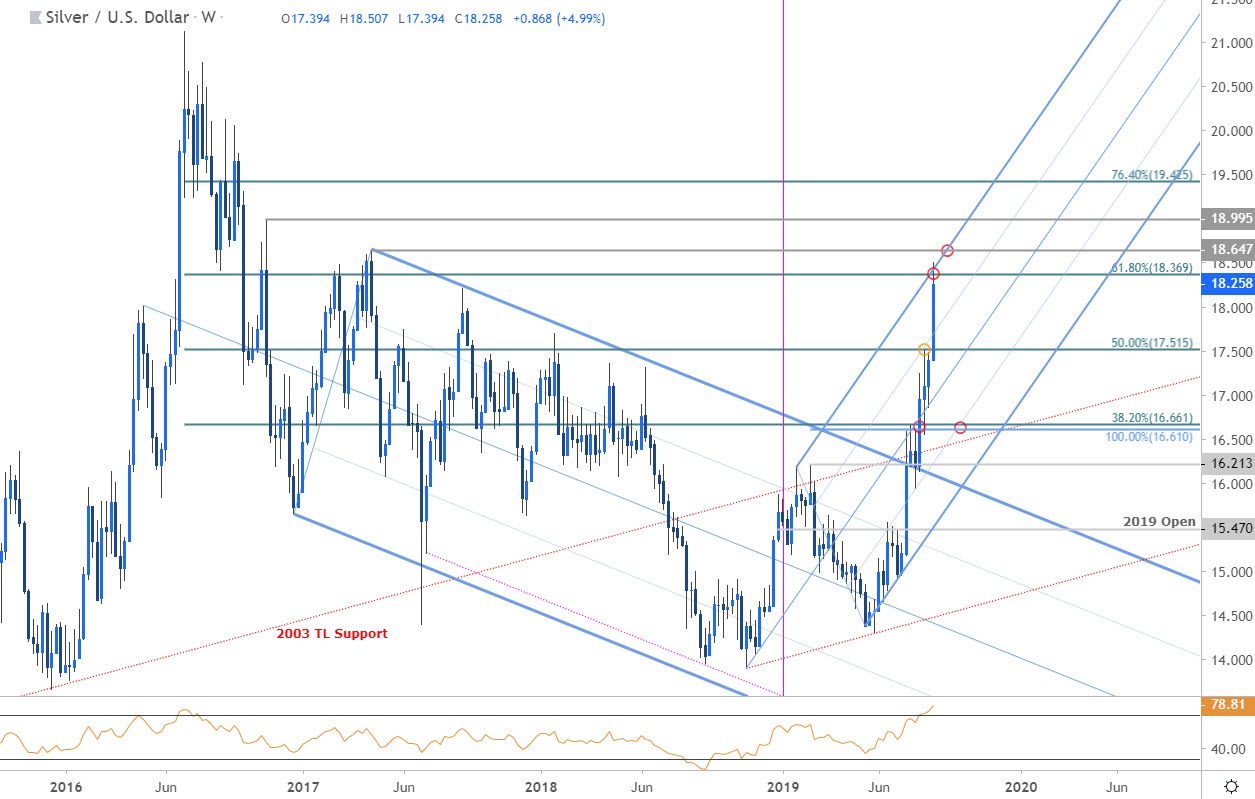
Chart Prepared by Michael Boutros, Technical Strategist; Silver on Tradingview[3][4]
Notes: In my previous Silver Price Weekly Outlook we noted that XAG/USD was “approaching the first major resistance hurdle at 16.61/66 – a breach / weekly close above is needed to keep the long-bias viable targeting 17 and beyond.” A topside breach two weeks later fueled the next leg higher in price with silver now probing a more significant resistance confluence at 18.37 (high registered at 18.50 before pulling back). This region is defined by the 61.8% retracement of the 2016 decline with the upper parallel of the ascending pitchfork formation we’ve been tracking off the 2018 low - just higher. [5][6]
A topside breach / weekly close above the 2017 swing high at 18.65 is needed to validate a breakout with such a scenario keeping the focus on subsequent topside resistance objectives at the 19-handle and the 76.4% retracement at 19.42. Initial weekly support now back at the 75% parallel (currently ~17.70s) backed b 17.52. Broader bullish invalidation now raised to 16.61/66.[7]
For a complete breakdown of Michael’s trading strategy, review his Foundations of Technical Analysis
