

Oil Price Talking Points:
- Oil prices have spent much of the past two weeks recovering after sellers were re-buffed at seven-month-lows.
- WTI crude oil[1] prices have pushed back for a re-test of trendline resistance and this helped to stall the bullish advance last week: Is another bearish turn around-the-corner in oil prices?
- DailyFX Forecasts are published on a variety of markets such as Gold, the US Dollar or the Euro and are available from the DailyFX Trading Guides page. If you’re looking to improve your trading approach, check out Traits of Successful Traders. And if you’re looking for an introductory primer to the Forex market, check out our New to FX Guide.[2][3][4][5][6][7]
Crude Oil Stabilizes Above 55, Runs into Trendline Resistance
WTI crude oil prices have spent the past two weeks trading higher after re-testing a key support zone on August 7th. That support was the same zone of prices that helped to arrest the April-May sell-off following a 24% decline; and its now held two bearish trends that threatened to break-below the psychological 50-handle.
At this stage, that support bounce has extended and last week brought in a key level of resistance around 57.34, which is confluent with a bearish trend-line taken from late-July swing-highs. That trendline has come back into play after buyers were able to cauterize support above the 54-handle. [8]
WTI Crude Oil Four-Hour Price Chart
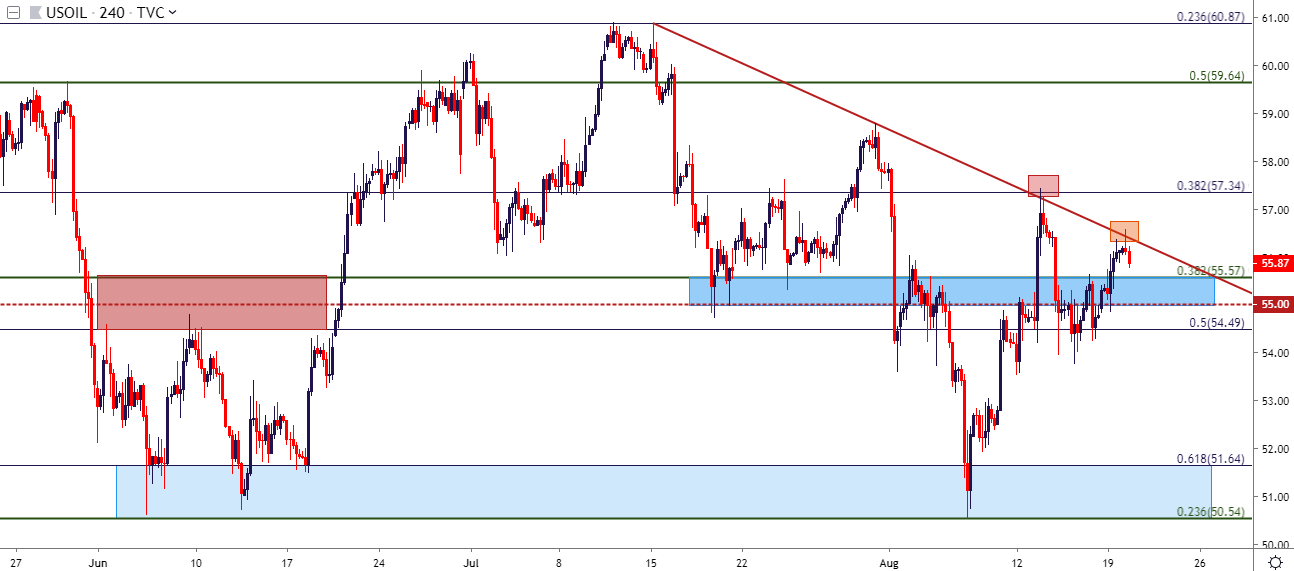
Chart prepared by James Stanley; Oil on Tradingview[9][10]
Can Support Hold a Third Test?
The support zone that runs from 50.54-51.64 has now been tested twice in the past three months and each
