

The Canadian Dollar is down more than 2.4% against the US Dollar since the July lows in USD/CAD with price now approaching a key inflection zone just higher. These are the updated targets and invalidation levels that matter on the USD/CAD charts this week. Review this week's Strategy Webinar for an in-depth breakdown of this silver price[4] setup and more.[1][2][3]
New to Forex[5] Trading? Get started with this Free Beginners Guide[6]
Loonie Price Chart – USD/CAD Daily
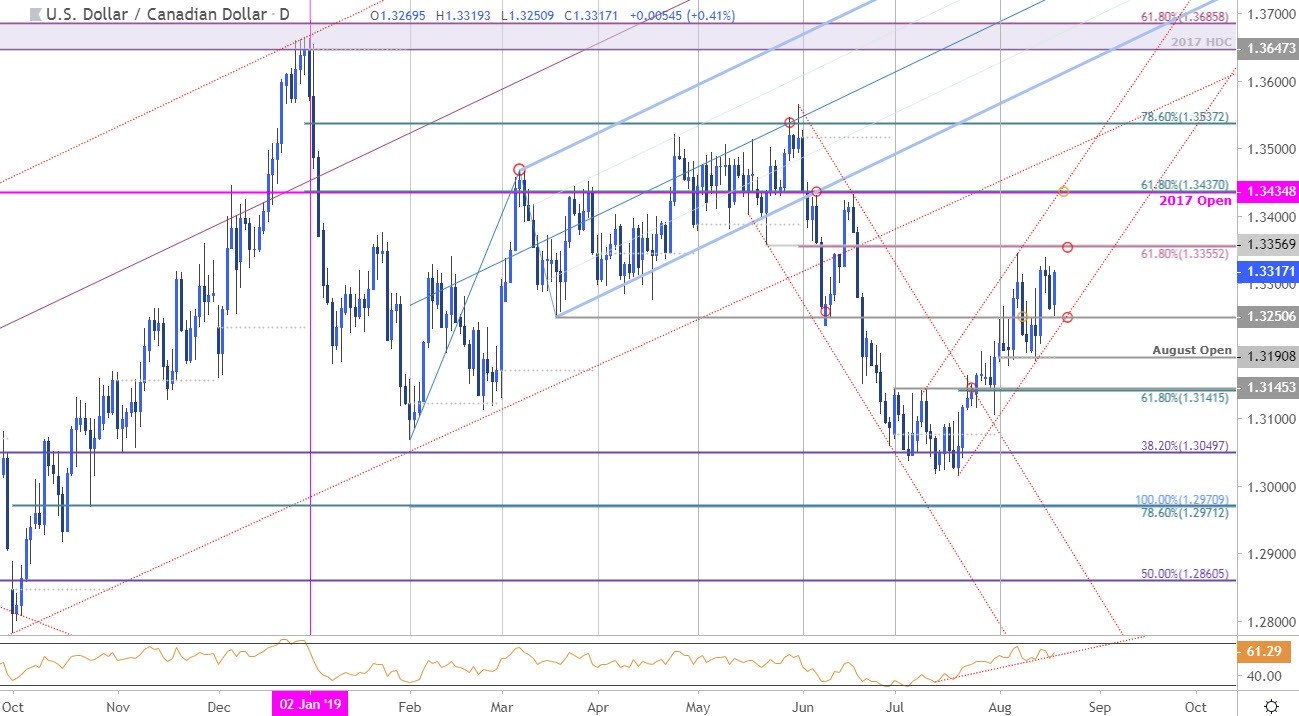
Chart Prepared by Michael Boutros, Technical Strategist; USD/CAD on Tradingview[7][8]
Technical Outlook: In my last USD/CAD Weekly Trade Outlook we noted that price was approaching a key resistance zone, “at the 61.8% retracement of the May decline / 2019 high-week close at 1.3355/70 backed by the trendline confluence around ~1.3430s- a weekly close above this level would be needed to suggest a larger price reversal is underway.” USD/CAD has failed just ahead of this threshold early in the month with price trading in a near-term consolidation just below- note the building divergence / pending support trigger on the daily momentum profile. [9]
Why does the average trader lose? Avoid these Mistakes in your trading[10]
Loonie Price Chart – USD/CAD 240min
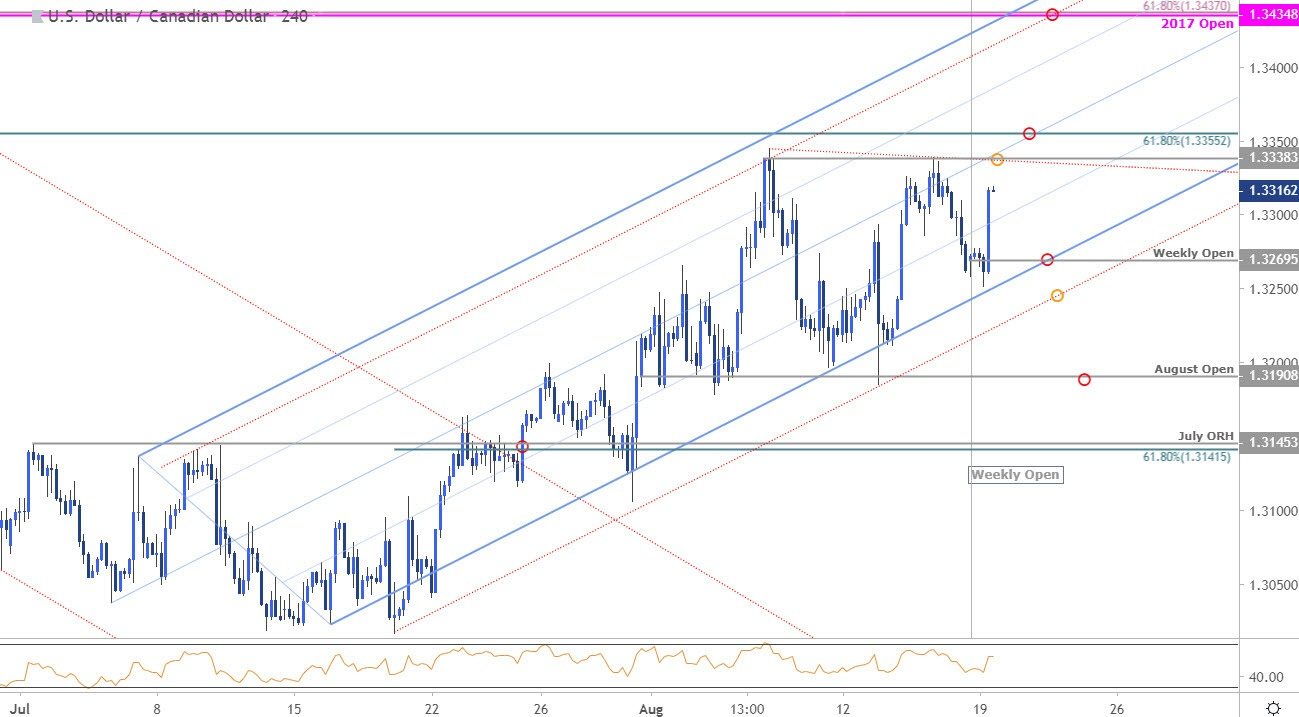
Chart Prepared by Michael Boutros, Technical Strategist; USD/CAD on Tradingview[11][12]
Notes: A closer look at Loonie price action sees USD/CAD trading within the confines of an ascending pitchfork formation extending off the July lows with the upslope further highlighting the 1.3338/55 resistance zone – looking for a pivot off this zone. [13]
A topside breach
