

Gold Price Talking Points:
Gold Prices Pull Back to Support
Gold prices are currently testing a level of support at 1509 after setting another fresh six-year-high earlier this week. As discussed in yesterday’s webinar, the longer-term resistance zone that runs from 1509-1527 has helped Gold’s short-term price action build into a range; and a support inflection off of the 1509 level kept the door open for aggressive bullish trend strategies. [1][2]
Gold Price Two Hour Chart
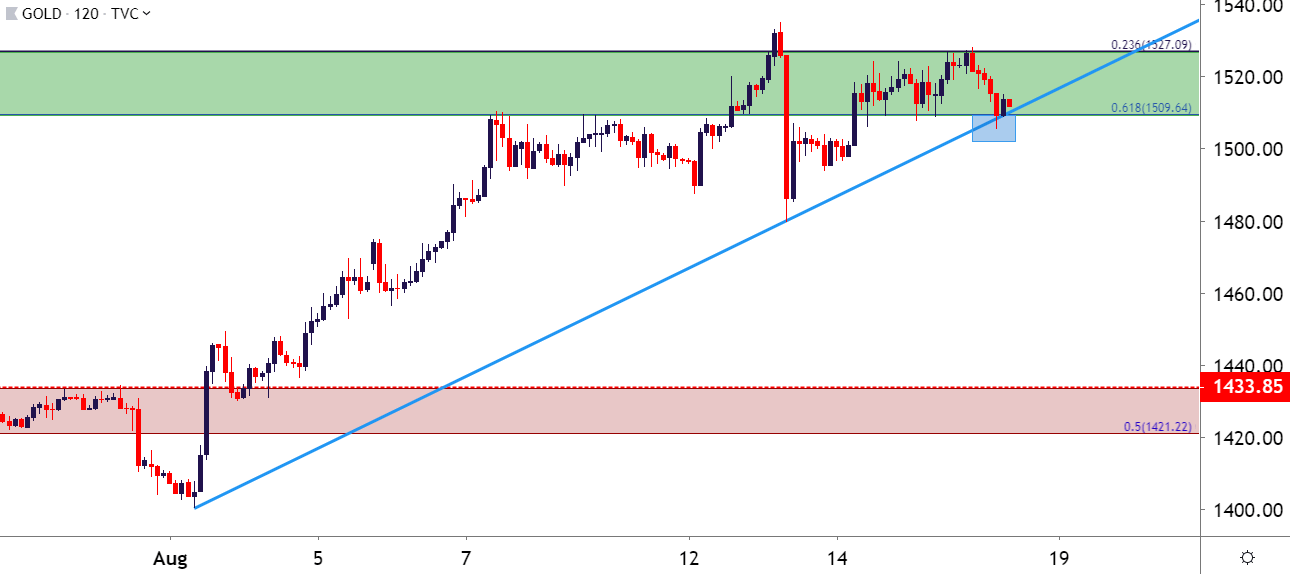
Chart prepared by James Stanley; Gold on Tradingview[3][4]
The Bigger Picture Backdrop for Gold Prices
Fear continues to populate the backdrop and for Gold prices, that’s generally a ‘good’ thing despite the related ramifications. As a number of risks remain in the headlines and at this point, the Fed has been noticeably silent on the matter; markets have been left to their own projections and prognostications and Gold prices have put in some serious incline already in 2019, continuing to push up to fresh six-year-highs despite remaining overbought. That’s what has quickly brought this zone back into play. [5]
Gold Price Weekly Chart

Chart prepared by James Stanley; Gold on Tradingview[6][7]
The current zone of resistance comes from two different Fibonacci levels at 1509 and 1527, with the former of those prices as the 61.8% retracement of the 2012-2015 major move and the latter serving as the 23.6% marker of the longer-term bullish run from 1999 into the 2011 highs. I had started looking at this zone for topside target potential about a month ago and when price action had stalled in the 1421-1433 zone. But as risk aversion caught a bid around the FOMC[10] rate cut and
