

Silver prices[1] have surged to levels not seen since January 2018 with the rally at risk near-term while below broader uptrend resistance. These are the updated targets and invalidation levels that matter on the XAG/USD charts heading into the close of the week. Review this week's Strategy Webinar for an in-depth breakdown of this silver price setup and more.[2]
New to Forex[3] Trading? Get started with this Free Beginners Guide[4]
Silver Price Chart – XAG/USD Daily
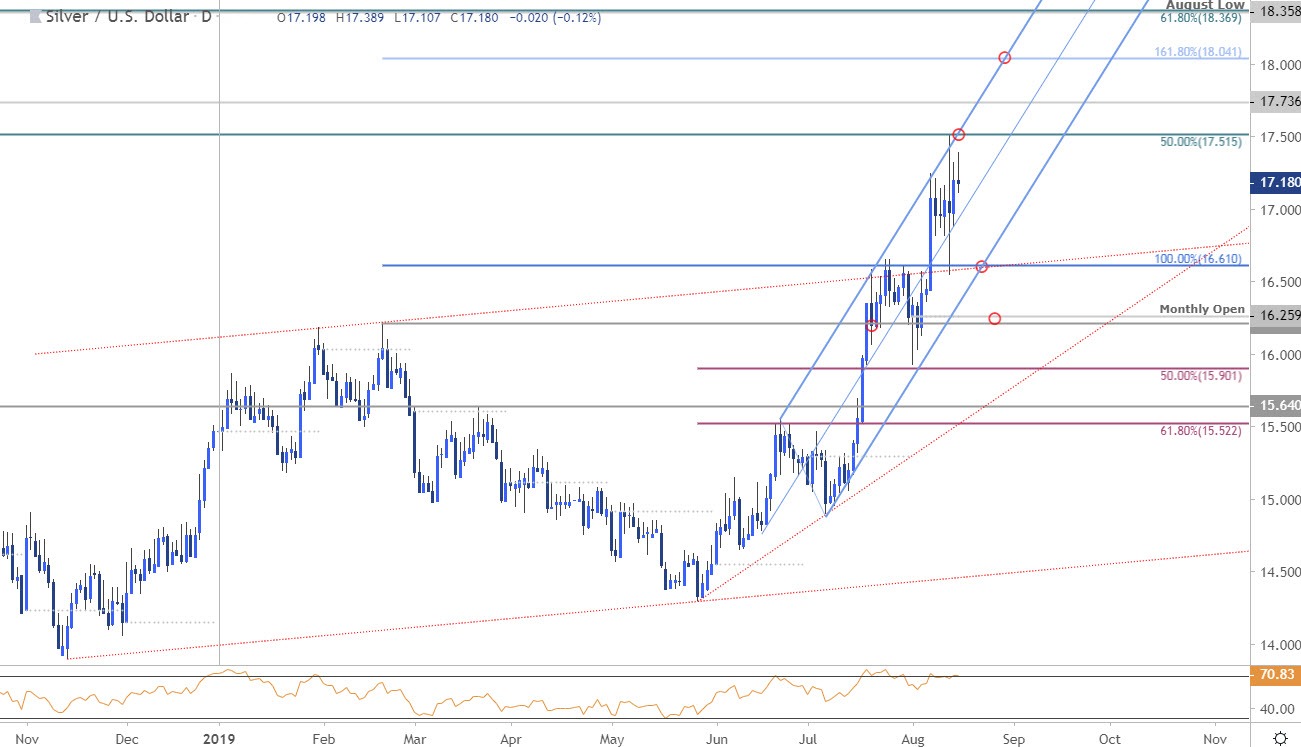
Chart Prepared by Michael Boutros, Technical Strategist; Silver (XAG/USD) on Tradingview[5][6]
Technical Outlook: In my last Silver Weekly Price Outlook we noted a long-bias on XAG/USD while above 1588 with above the 16.61/66 resistance hurdle targeting, “topside objectives at the June swing highs at 17.32 backed by the 50% retracement at 17.51.” Silver registered a high at 1750 early in the week before pulling back with the weekly opening-range still intact heading into Friday. Note that the upper parallel also converges on this range into the close of the week and further highlights its technical significance. [7][8]
Key daily support now rests at the highlighted trendline confluence around 16.61 with broader bullish invalidation now at the February high / August open at 16.21/25. A topside breach / close above this threshold is needed to keep the long-bias viable targeting subsequent resistance objectives at 17.74 and 18.04.
Why does the average trader lose? Avoid these Mistakes in your trading[9]
Silver Price Chart – XAG/USD 120min
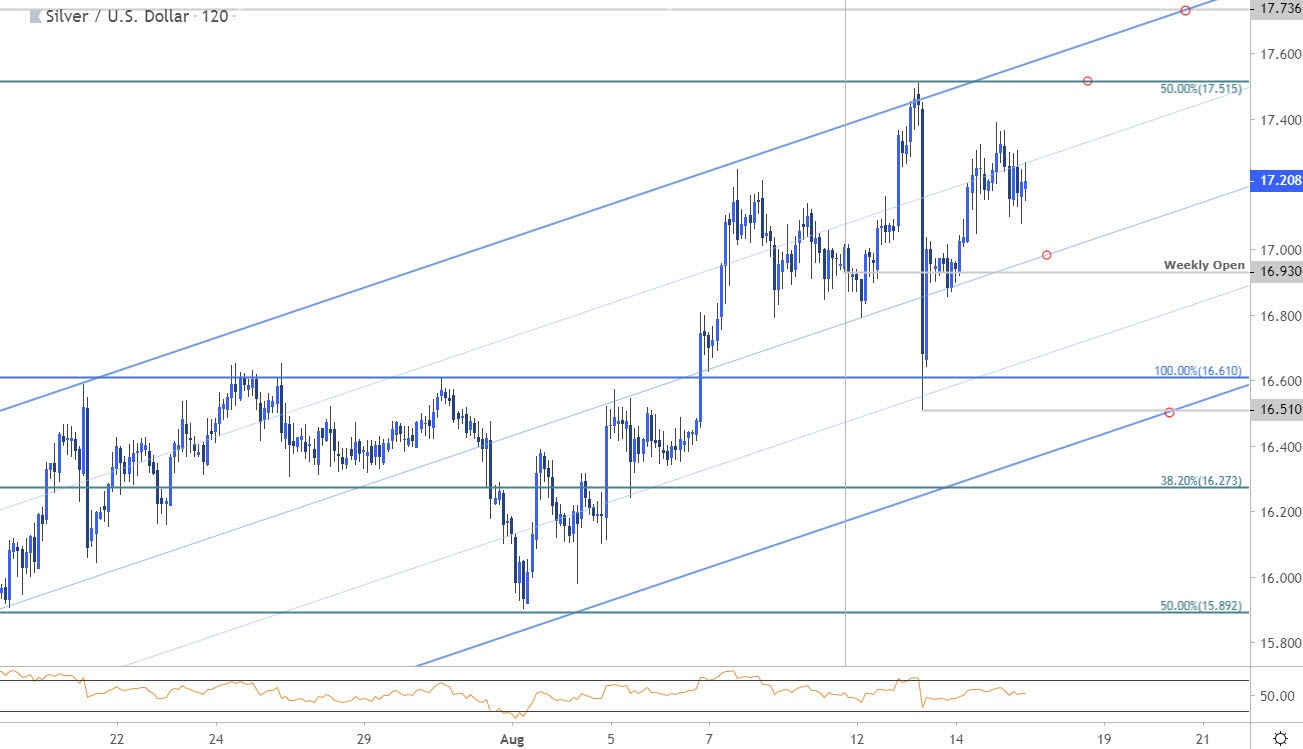
Chart Prepared by Michael Boutros, Technical Strategist; Silver (XAG/USD) on Tradingview[10][11]
Notes: A closer
