

Dow Jones, Nasdaq 100, S&P 500 Forecast:
- The SPY ETF recorded the largest intraday outflow since October’s equity rout
- Data from prior outflows of such magnitude suggest equity turmoil may persist
- Sign up for our Weekly Equity Outlook Webinar to gain stock market insight through the lens of global macro trends. [1]
Dow Jones, Nasdaq 100, S&P 500 Forecast: ETF Flows Hint at Bearishness
Monday saw the Dow Jones[2] plummet over 750 points after a significant escalation in the US-China trade war. Investor confidence was rocked as traders scurried to reduce exposure to the S&P 500[4], Nasdaq[5] 100 and Dow Jones. ETF flow data recorded by Bloomberg reveals the capital flight for some of the market’s largest funds was similar to that of the reallocation during the equity rout last October. [3]
Investors Ditch S&P 500 Exposure
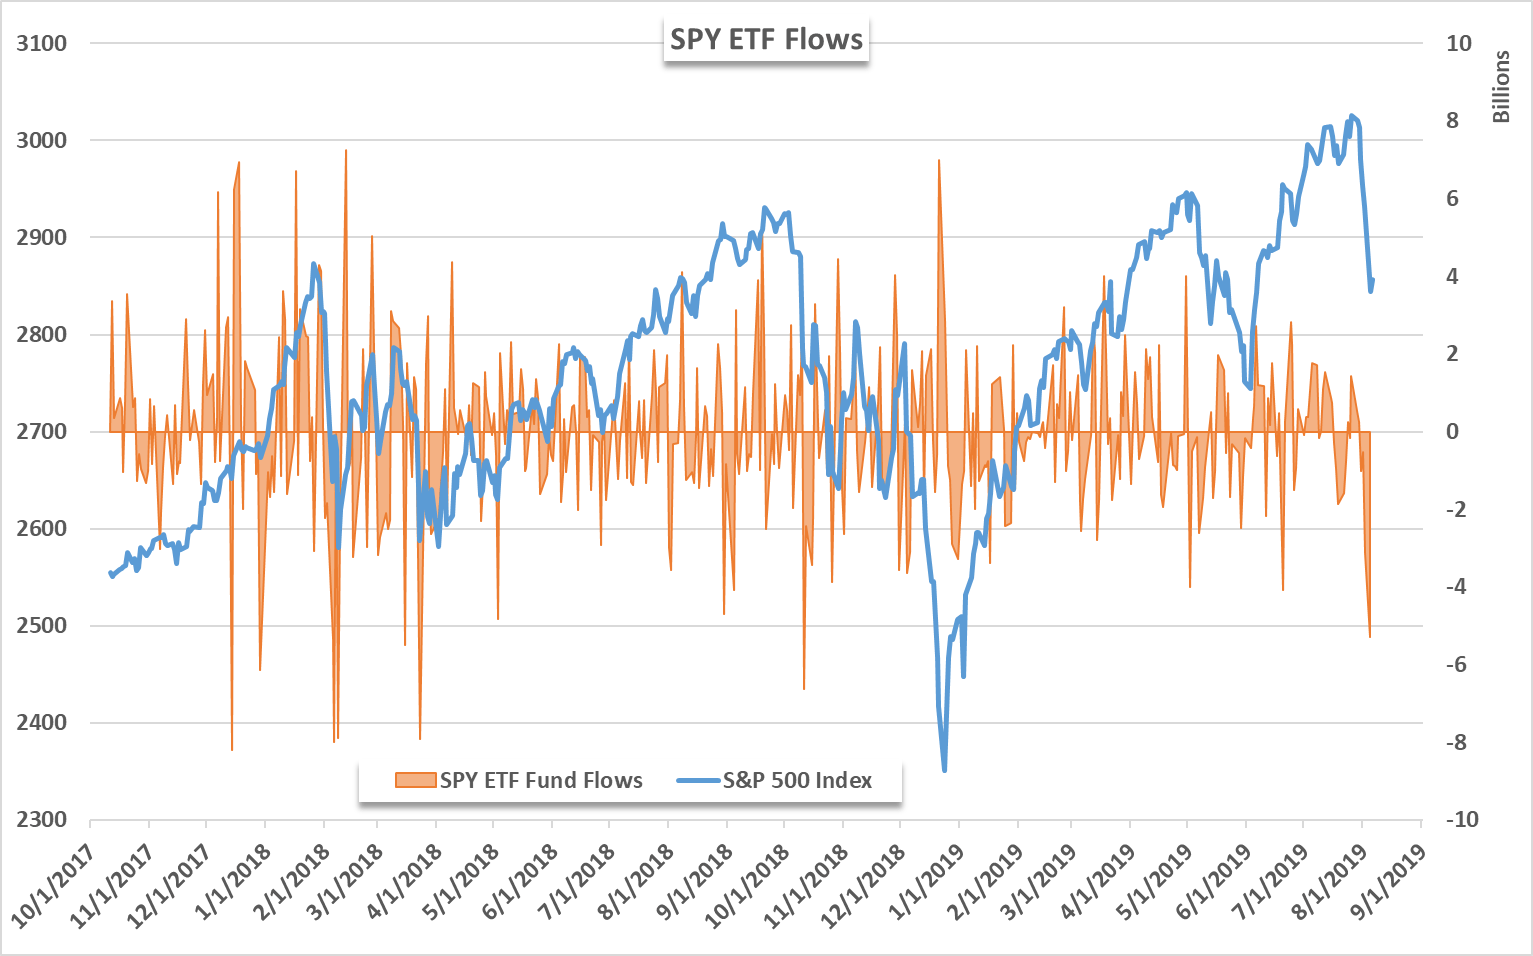
To that end, over -$5.2 billion exited the SPY ETF during Monday’s session. The outflow is the largest on an intraday basis since October 11, 2018 when the S&P 500 dropped -2%. Across a broader timeframe, the SPY ETF has now seen almost -$9 billion leave its coffers in the month of August alone. Monday’s outflow puts the year-to-date net flows at a negative $17.4 billion. The staggering exodus of funds is just the seventh instance of an outflow over -$5 billion since the beginning of 2018.
Unfamiliar with past trade wars? Check out our guide,ABrief History of Trade Wars.[6]
That said, Monday’s outflow narrowly made the $5 billion cutoff and is the smallest instance above the watermark. While seemingly an arbitrary hurdle, capital migration of such magnitude - from the world’s most liquid ETF – is indicative
