

Silver prices[1] have rallied nearly 15% from the yearly lows registered in May with last week marking the largest weekly range since July 2017 and the largest single-week advance since June of 2016. Silver is now eyeing a critical resistance zone just above the yearly opening-range highs. These are the updated targets and invalidation levels that matter on the XAG/USD weekly price chart. Review my latestWeekly Strategy Webinar[2] for an in-depth breakdown of this silver price setup and more.
New to Trading? Get started with this Free Beginners Guide[3]
Silver Price Chart – XAG/USD Weekly
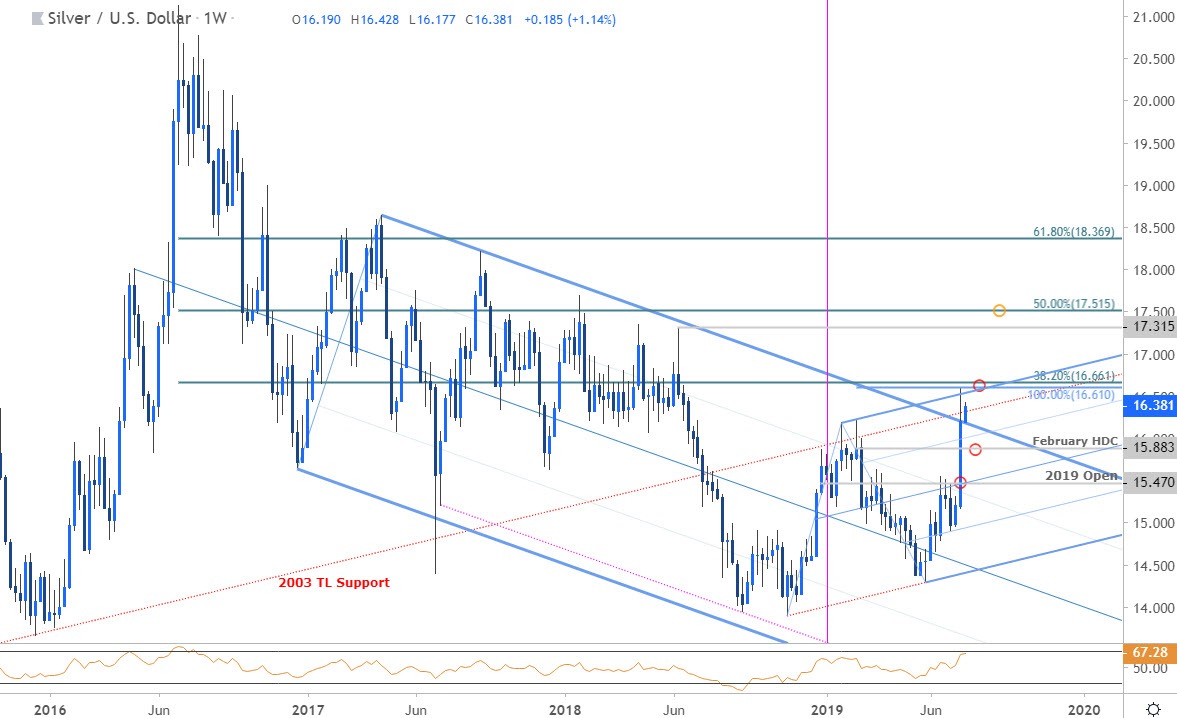
Notes: Silver prices broke above confluence resistance around the yearly open last week at 15.47 – a subsequent rally of more than 8% takes price into the first major resistance target at 16.61/66 – a region defined by the 100% of the November advance and the 38.2% retracement of the 2016 decline. Price registered a high at 16.59 last week and wile the broader focus is higher, the immediate advance may be vulnerable below this level with pitchfork[4] resistance further highlighting this threshold over the next few weeks. Note that the yearly opening-range high comes in at 16.21 – price has yet to clear this on a close basis.
Initial support rests back at 16.21 backed by the February high-day close at 15.88- area of interest for downside exhaustion IF reached. Broader bullish invalidation now raised to 15.47. A topside breach of this key resistance zone exposes subsequent topside objectives at the June swing highs at 17.32 backed
