

Gold Price Weekly Technical Forecast:
Gold Prices Pullback From Fresh Six-Year-Highs
Gold prices[1] have moderated after last week’s breakout. That bullish push showed-up with aggression last Thursday around some confusion in the US Dollar[2], with Gold bulls pushing the yellow metal up to fresh six-year-highs. The 1450 level was crossed, albeit temporarily, as a wave of USD-weakness showed through a number of markets. Friday morning trade saw that theme pull back, and Gold prices pulled back to find support around the 1421.22 level, which is the 50% marker of the 2012-2015 major move. This level had previously helped to define resistance and so far this same price has helped to hold support through this week’s open.
Gold Price Two-Hour Chart

Chart prepared by James Stanley[3]
Taking a step back, and Gold prices are currently exhibiting support at prior resistance[4]. For traders looking to move forward in an aggressive manner, this can keep the door open for bullish strategies with stop potential investigated underneath last Thursday’s swing-low, taken from around the 1414 level on the chart; and if that doesn’t hold, bullish entries could be investigated lower, around the same 1400 level that came into play twice last week as support[5].
Gold Price Eight-Hour Chart
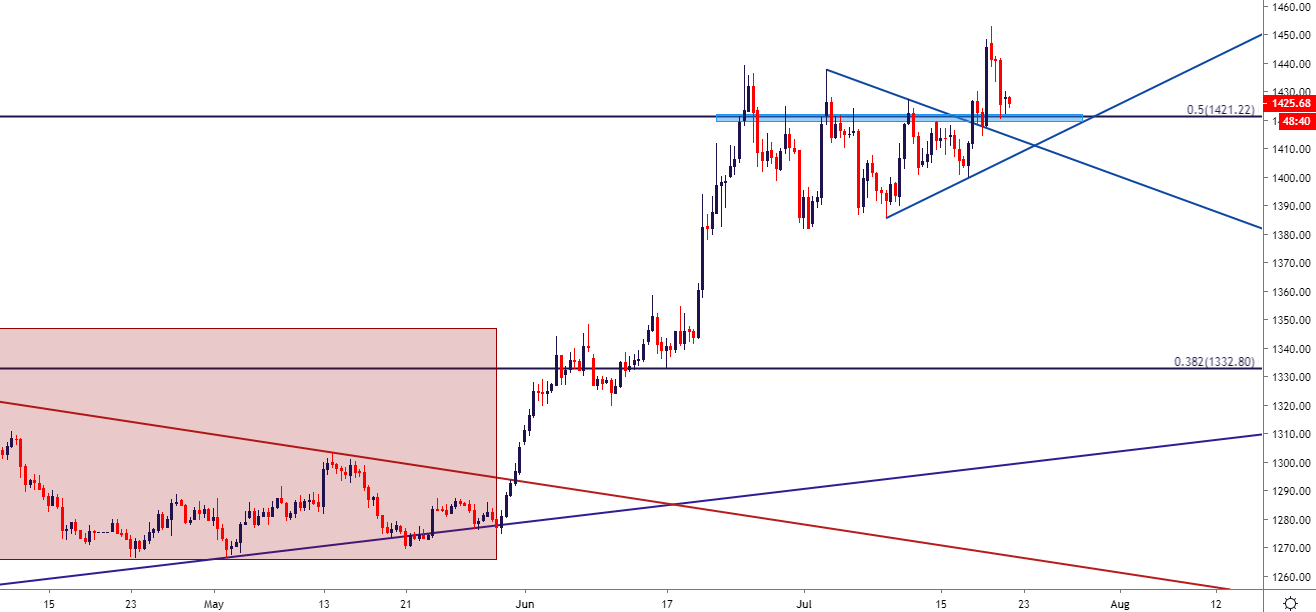
Chart prepared by James Stanley[6]
Gold Prices Longer-Term
Taking a further step back on the chart, and the zone of resistance that’s currently helping to hold short-term support seems an imposing area on the chart. Despite last week’s push up to fresh six-year-highs, this zone has held weekly resistance for the past four completed weeks, and this is reason enough for
