

Crude Oil Price Outlook Talking Points:
Oil Prices Break Below Bear Flag and Continue to Go
Oil prices have been on offer this week as last week’s bid around supply disruptions in the Gulf has been faded-out of the market. Coming into this week, there was the potential for topside run, largely on the basis of last week’s production draw on the back of the brewing Tropical Storm Barry. But, that storm was downgraded over the weekend and the supply disruptions appear to be less-than-feared. This has allowed for sellers to re-take control of Oil prices, bringing back the recent theme of weakness that’s been fairly-clear since June trade[1] and re-opening the door for a trip back to the 55-level in WTI crude oil prices.
As discussed last Friday, the zone of prices from 59.64-60.00 was a key area on the chart[2], and a push back below that level would re-open the door for short-side strategies. That happened shortly after this week’s open, and prices soon pushed-lower and then created a bear flag formation. After a re-visit to the 60-level for resistance, that bear flag unwound with aggression over the past few trading days[3], running through both targets on the way to fresh three-week-lows.
WTI Crude Oil Hourly Price Chart
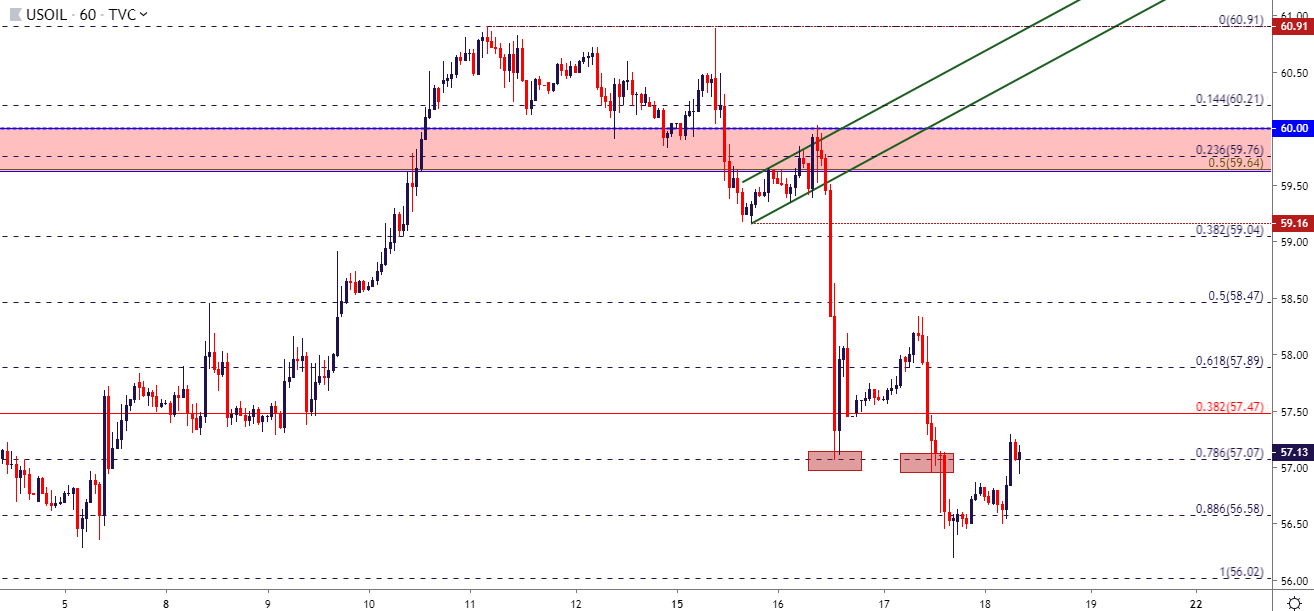
Chart prepared by James Stanley[4]
Taking a step back on the chart and another set of levels becomes of interest. From the Daily chart, the topping-out scenario that played into this week’s open becomes a bit more explainable, as the Thursday and Friday dojis from last week came-in right around the 23.6% retracement of the December-April bullish run; and short-term resistance is showing
