

Stock Market Outlook:
- The VIX trades beneath 13 as the S&P 500[1] boasts a new record high, does the relationship between the two offer insight on future performance?
- Holiday trading hours create prime conditions for Black Swan Events[2] and Stock Market Crashes[3]
- Across comparable periods, the relationship between the S&P 500 and VIX is notably weaker in 2019 than in 2018
Stock Market Outlook: VIX Signals Complacency as S&P 500 Tags Record
The S&P 500 rallied on Wednesday as traders leave their desks and markets wind down for the Independence Day Holiday. Due to the conditions, volume has been drained and the potential for a tail-risk event is heightened. Despite the precarious landscape, Cboe’s volatility index (VIX) or “fear gauge,” is probing 2-month lows.
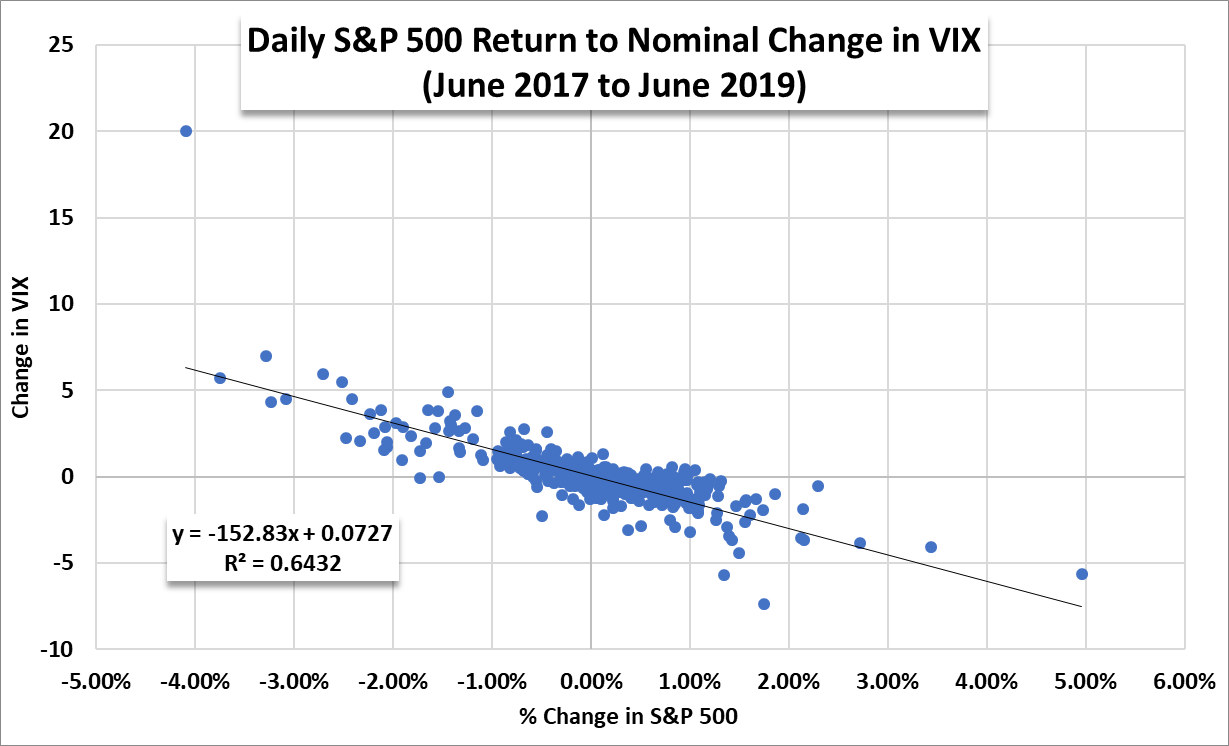
Data Source: Bloomberg
Over the last two years ending in June, the R-squared measure between the S&P 500 and the VIX has been statistically significant at 64% - but marginally weaker than it was from March to March.[4] In other words, 64% of the movement in the VIX can be explained by a shift in the S&P 500. But over the last month, the dependency of the VIX on the S&P 500 has broken down.
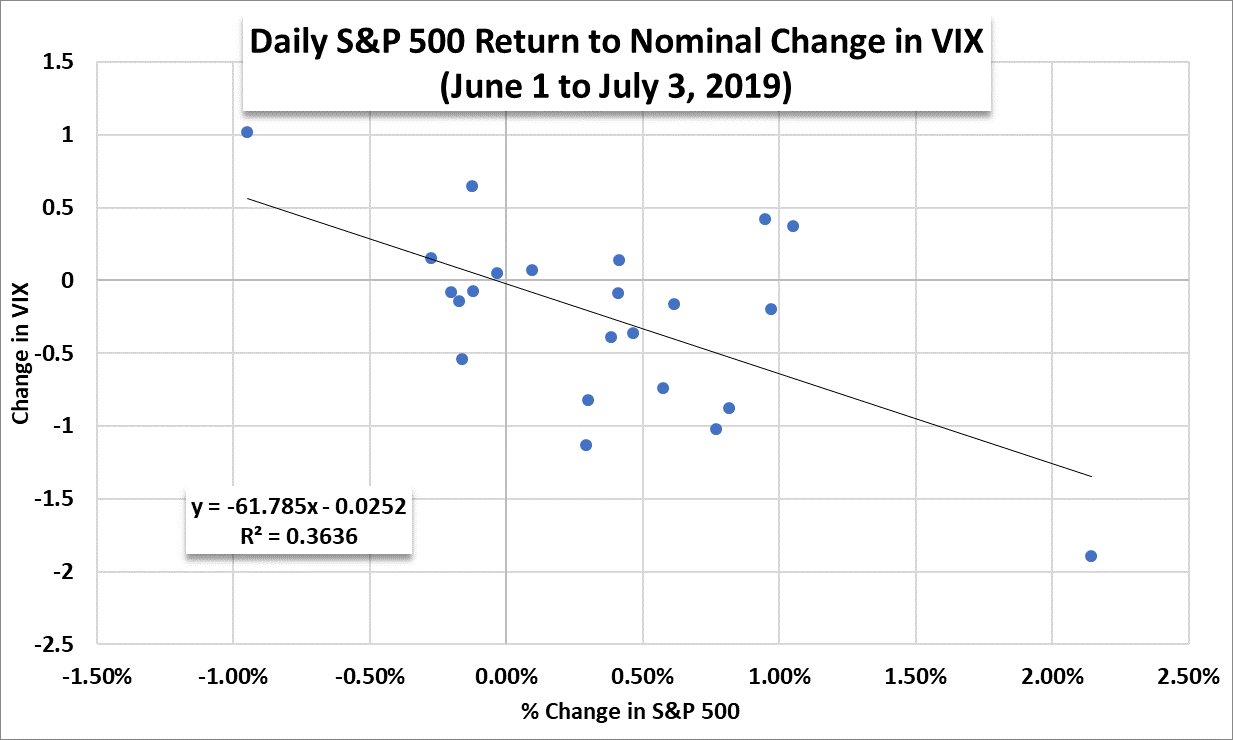
Data Source: Bloomberg
Since June 1, only 36% of the changes in the VIX can be explained by the underlying S&P 500. The relationship is noticeably beneath the longer-term 64% and when compared to the same span in the prior year, the difference is even more drastic – partially
