

The New Zealand Dollar[1] is the top performer against the US Dollar[2] this week with NZD/USD[3] rallying nearly 2% ahead of the close on Friday. The advance takes price into a resistance range we’ve been tracking for days now and the focus is on the monthly close for guidance. These are the updated targets and invalidation levels that matter on the NZD[4]/USD[5] charts heading into July. Review this week’s Strategy Webinar[6] for an in-depth breakdown of this Kiwi setup and more.
New to Forex[7] Trading? Get started with this Free Beginners Guide[8]
Kiwi Price Chart - NZD/USD Daily
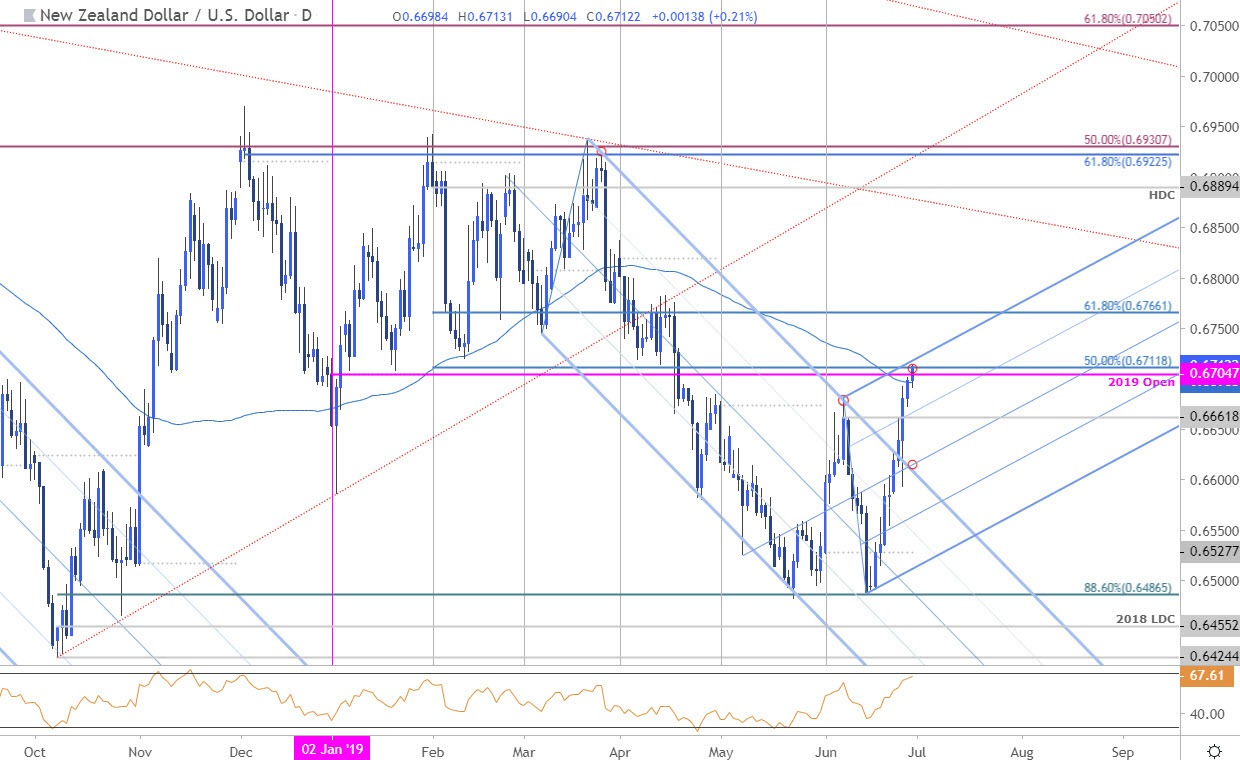
Technical Outlook: In my latest New Zealand Dollar Price Outlook[9] we noted that the Kiwi, “advance now targeting the resistance at 6705/12 – a region defined by the 2019 open and the 50% retracement of the yearly range.The focus is on a reaction off this zone on the back of a seven-day advance in Kiwi with the immediate long-bias at risk into the yearly open.” NZD/USD is poised to mark a ninth consecutive daily advance if price closes at these levels with the rally now probing the 6705/12 resistance zone.
Watch the close of the week / month / quarter – a breach would keep the focus on the 61.8% retracement[10] of the yearly range at 6766. Interim daily support rests at 6662 with broader bullish invalidation down at the highlighted trendline confluence around the 66-handle.
Why
