Crude Oil Price Talking Points:
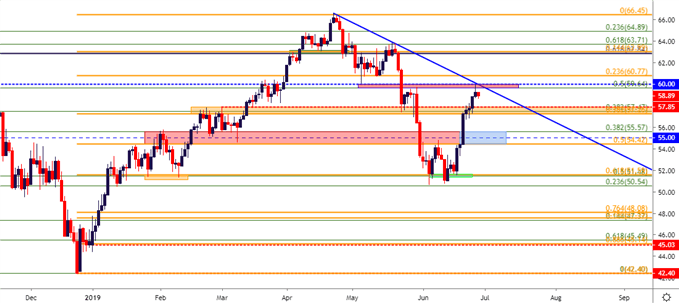
- The April-May sell-off on crude oil[1] has finally found some element of resistance inside of the 60-handle, which coincides with a trend-line projection as taken from the April and May swing highs.
- This two-week bounce has seen price action[2] retrace more than 50% of that prior bearish move; are oil markets on the cusp of a bigger-picture bullish theme? An OPEC meeting on July 1-2 can assist on the driver side of the matter, one way or the other.
Crude Oil Price Tests Resistance at 60 Handle
Oil prices have continued the rally after[3] cauterizing fresh five month-lows earlier this month, breaking above a near term level of resistance earlier this week. While oil prices were flying high as the risk trade was in full bloom through April, a strong turn developed that pushed oil prices lower throughout the month of May and into June[4]. Support finally showed up in the first week of the month, and after almost two full weeks of consolidation, buyers were able to take-control of the matter, helped along the way by last week’s FOMC[5] rate decision that served to push the bid in a number of risk markets.
Crude Oil Price Chart – Daily

Chart prepared by James Stanley[6]
The big question at this point is whether the bullish trend is back again or whether this is a mere pullback in the sell-off that started two months ago; and given context there could be a valid case to make on either side of the matter.


