

The British Pound rallied more than 2.2% off the June lows with the advance failing to breach / close above the monthly opening-range highs / yearly open resistance. These are the updated targets and invalidation levels that matter on the GBP[1]/USD[2] charts into the close of the month. Review this week’s Strategy Webinar[3] for an in-depth breakdown of this setup and more.
New to Forex[4] Trading? Get started with this Free Beginners Guide[5]
Sterling Price Chart - GBP/USD Daily
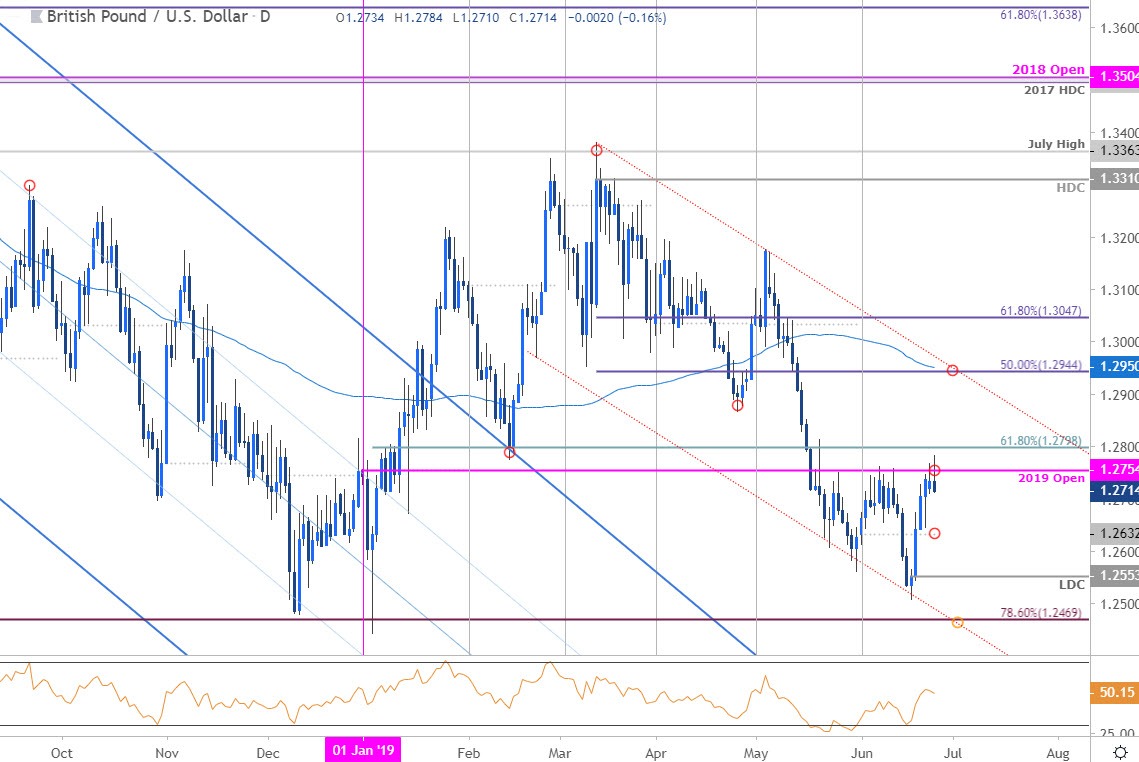
Technical Outlook: A five-day rally in the British Pound covered the entire June range with price struggling once again to breach above objective yearly open resistance at 1.2754. Note that the 61.8% retracement of the yearly range rests just higher at 1.2798 and ultimately, a breach / close above this threshold is needed to suggest that a more significant Sterling low is in place. Subsequent topside resistance objectives at the April lows at 1.2866 and 1.2944/50.
Daily support rest with the monthly open at 1.2632 – Ultimately a break below the low-day close at 1.2553 would be needed to mark resumption of the broader downtrend with such a scenario targeting the 78.6% retracement[6] at 1.2469.
Why does the average trader lose? Avoid these Mistakes in your trading[7]
Bottom line: Sterling has preserved the monthly opening-range heading into the final days of June with price failing today at yearly open resistance. From a trading standpoint, the risk is for correction off this threshold
