The New Zealand Dollar[1] is the worst performer year-to-date against the US Dollar[2] with NZD/USD[3] down more than 2.8%. A test of the May lows held last week with the recovery now eyeing near-term resistance. These are the updated targets and invalidation levels that matter on the NZD[4]/USD[5] charts heading in to tomorrow’s FOMC[6] interest rate decision. Review this week’s Strategy Webinar[7] for an in-depth breakdown of this setup and more.
New to Forex[8] Trading? Get started with this Free Beginners Guide[9]
Kiwi Price Chart - NZD/USD Daily
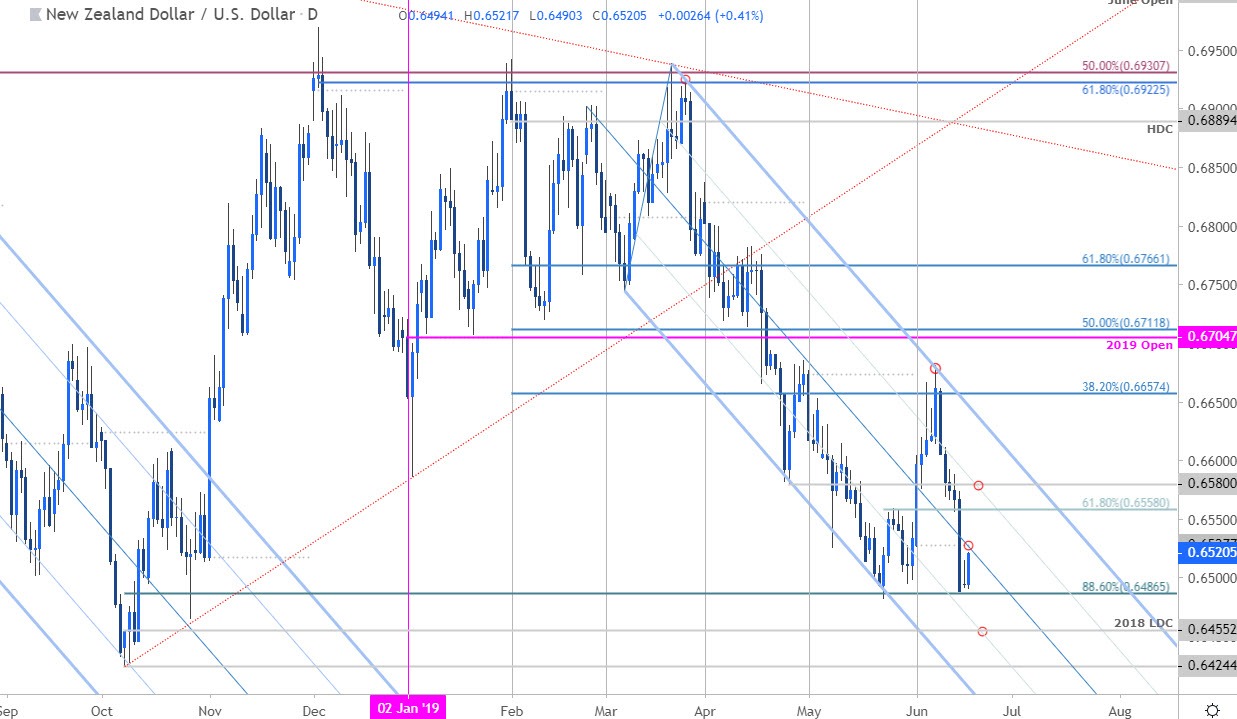
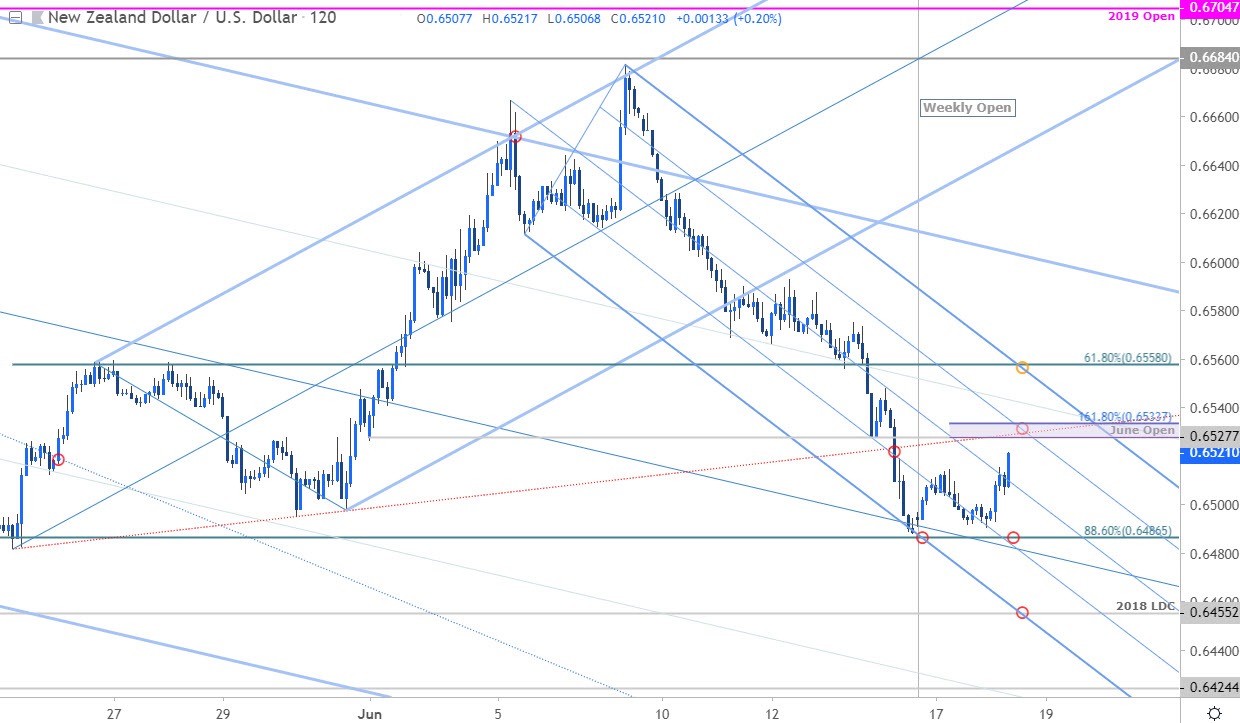
Technical Outlook: In my latest New Zealand Dollar Weekly Price Outlook[10] we noted that Kiwi had, “broken the monthly opening-range lows with the decline taking price into weekly support – risk remains for possible downside exhaustion.” Price turned just pips from the 88.6% retracement of the 2018 advance at 6487 with the subsequent rebound now targeting monthly open resistance at 6528.
A breach / close above the median-line is needed to suggest a larger recovery is underway targeting the 61.8% retracement[11] at 6558 and the April lows at 6580. Broader bearish invalidation stands with the upper parallel. A break lower from here would mark resumption of the March downtrend targeting the 2018 low-day close at 6455 & the 2018 low at 6424.
Why does the average trader lose? Avoid these Mistakes in your trading[12]
Kiwi Price Chart - NZD/USD 120min