

In this series we scale-back and look at the broader technical picture to gain a bit more perspective on where we are in trend. The US Dollar[1] has fallen more than 3.5% against the Japanese Yen[2] with price now testing a key technical support zone we’ve been tracking for months now. These are the updated targets and invalidation levels that matter on the USDJPY/USD weekly chart. Review this week’s Strategy Webinar[3] for an in-depth breakdown of this setup and more.
New to Forex[4] Trading? Get started with this Free Beginners Guide[5]
USD/JPY Price Chart - Weekly
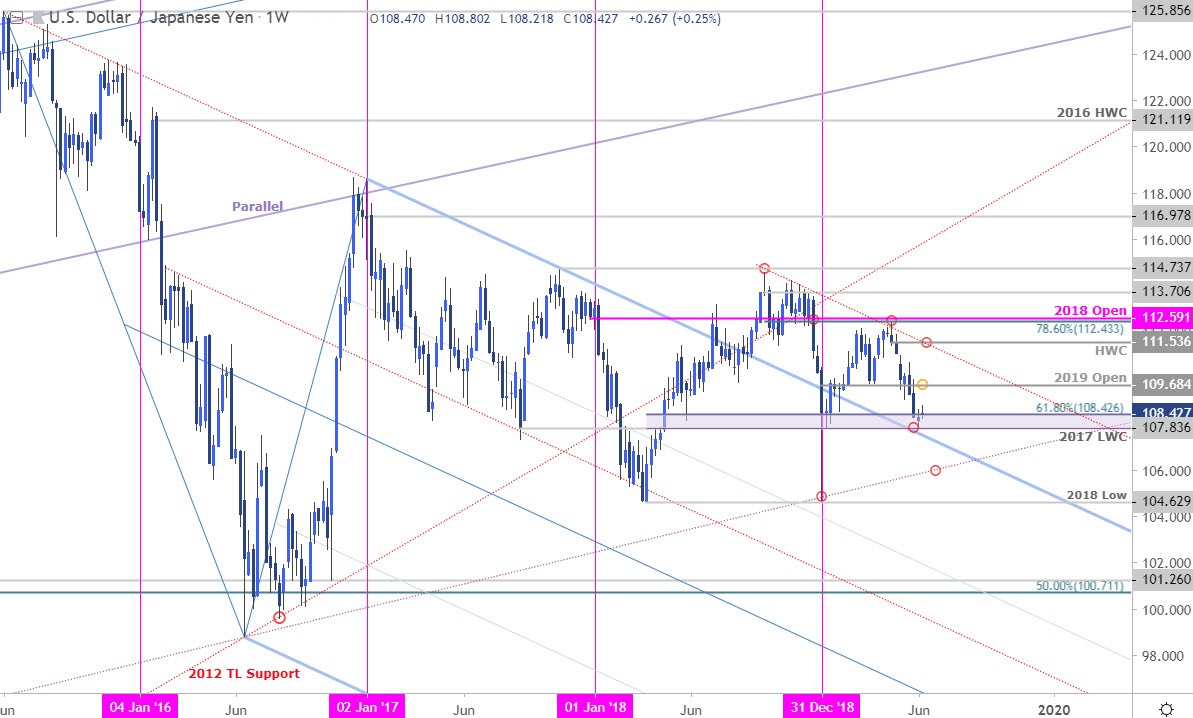
Notes: USD/JPY[6] is trading into a critical support zone we’ve been tracking for months now at 107.84-108.43- a region defined by the 61.8% retracement[7] of the 2018 advance and the 2017 low-week close. A break below this key zone is needed to keep the bears in control targeting the 2013 trendline just above the 106-handle. Resistance stands with the objective yearly open at 109.68 backed by the high-week close at 111.54. Ultimately a breach above 112.43/59 would be needed to shift the broader focus back to the topside in USD/JPY.
For a complete breakdown of Michael’s trading strategy, review his Foundations of Technical Analysis series on Building a Trading Strategy[8]
Bottom line: USD/JPY is testing BIG support this week and the focus is on a reaction off this mark. Watch the weekly close – above 108.43 would leave the risk for a recovery
