
Crude Oil Price Talking Points:
- Sellers haven’t left the Crude Oil market after a brutal month of May[1]. The latter-half of last week saw prices bounce from a key support zone, but sellers re-appeared this week after prices touched the resistance zone looked at in the early-month forecast for Crude Oil[2] Prices.
- Crude Oil has pushed down to the 51.50 area that was looked at for an initial target, but might bears be aggressive enough to elicit a run down to the 50 psychological level?
Crude Oil Collapse Continues After Resistance Inflection
Crude Oil prices experienced a stark change-of-pace in the month of May. While Oil prices had previously tracked the return of the risk trade fairly-well, bottoming out around Christmas and running-higher through Q1 and into April; sellers showed up in May, with aggression, to erase a large portion of that move. In short order, Crude Oil prices had cut through a number of support levels, making a hard-charge down to fresh four-month-lows.
In the Crude Oil Technical Forecast to start this month[3], I had looked at a series of levels that remain in-play. The resistance zone investigated that runs from 54.49-55.57 has now caught two different resistance reactions. The support level around 51.50 that was looked at for initial targets has now caught two separate inflections; the first of which was a mere speed bump on the way-lower while the second is helping to hold the lows right now.
WTI Crude Oil Four-Hour Price Chart: From Resistance to Support – Now What?
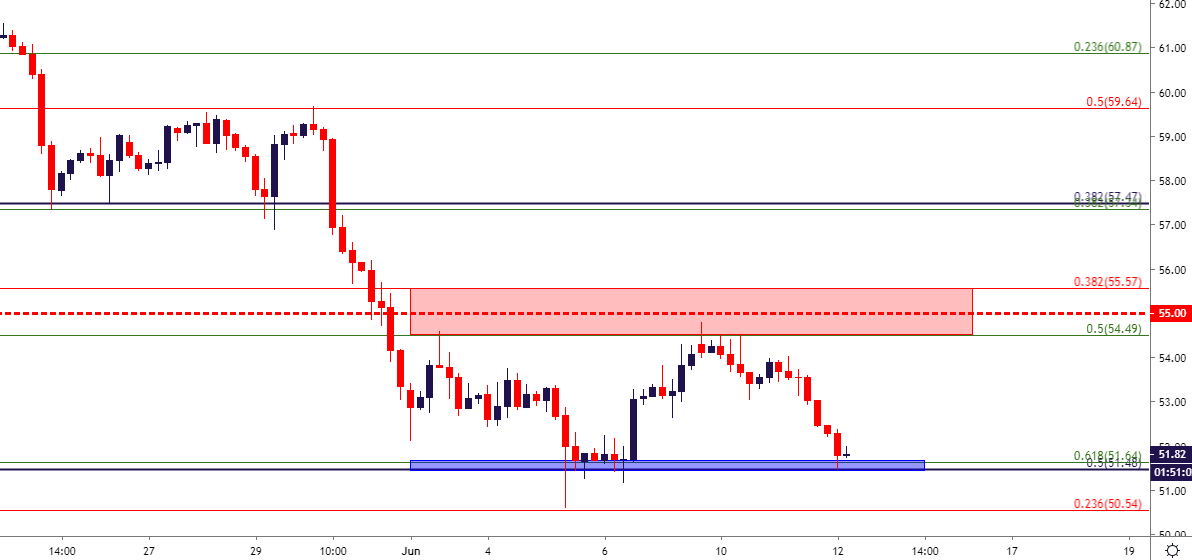
Chart prepared by James Stanley[4]
