

Kiwi rallied nearly 3% against the US Dollar[1] since the yearly lows registered last month with price responding to confluence resistance today in New York. These are the updated targets and invalidation levels that matter on the NZD[2]/USD[3] charts. Review this week’s Strategy Webinar[4] for an in-depth breakdown of this setup and more.
New to Forex[5] Trading? Get started with this Free Beginners Guide[6]
NZD/USD Daily Price Chart
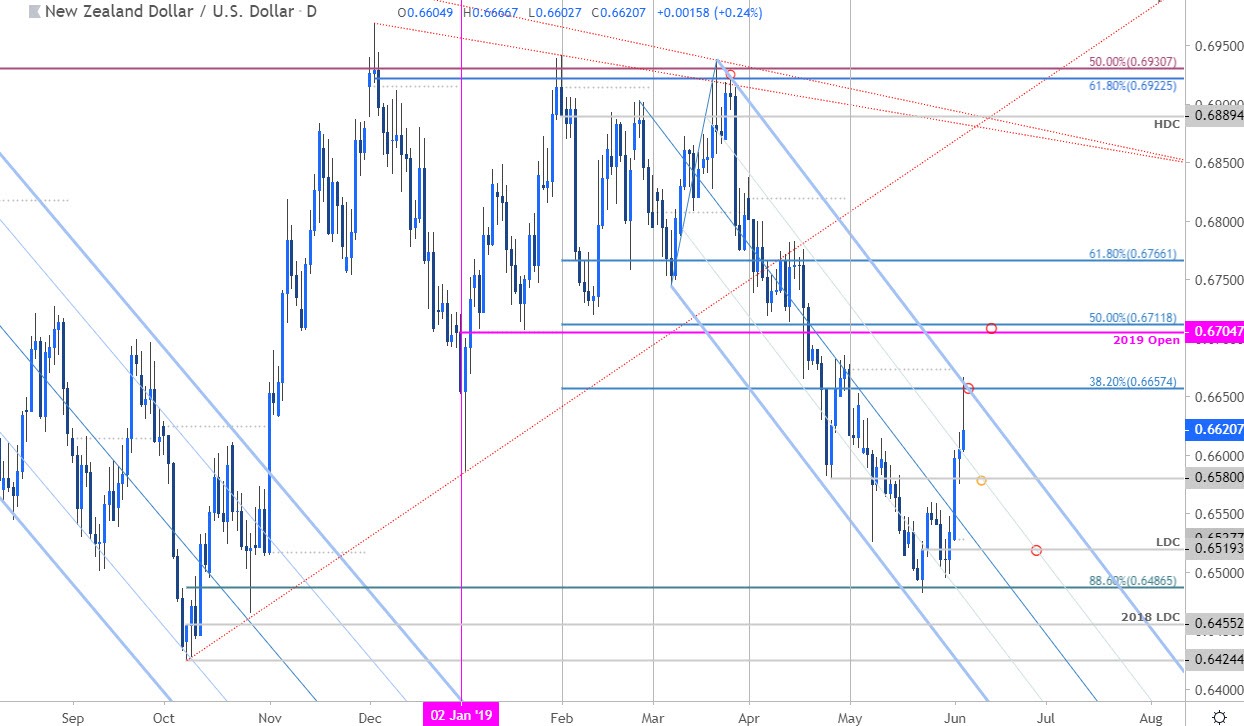
Technical Outlook: In my latest NZD/USD Weekly Price Outlook[7] we noted that, “Failure to mark a weekly close below 6507 would leave the immediate short-bias vulnerable heading into the start of June trade.” Kiwi posted a 2% rally into the monthly open before reversing off confluence resistance at 6657 where the 38.2% retracement of the yearly range converges on the pitchfork resistance. A breach / close above this threshold is needed to keep the long-bias viable targeting the yearly open / 50% retracement[8] at 6705/12. Interim support rests around 6570/80 with break / close below the low-day close at 6519 needed to mark resumption of the broader downtrend.
Why does the average trader lose? Avoid these Mistakes in your trading[9]
NZD/USD 120min Price Chart
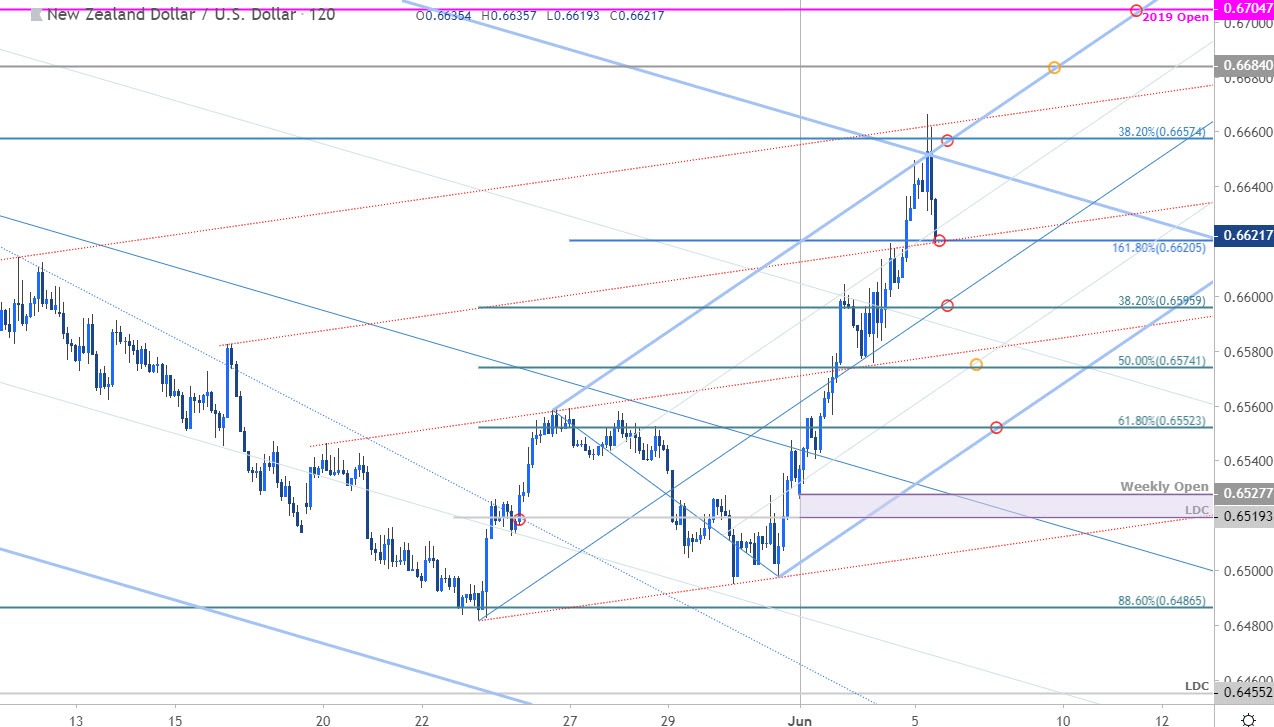
Notes: A closer look at price action shows Kiwi trading within the confines of an ascending pitchfork formation[10] extending off the May lows with the upper parallel further highlighting the 6657 resistance zone. The pullback is now testing initial support here
