

Crude Oil Price Talking Points:
Looking for longer-term forecasts on Oil prices? Check out the DailyFX Trading Guides[1].
Ahead of the weekly US Department of Energy inventory figures due out tomorrow, crude oil prices have taken a drop into fresh monthly lows amid rising global growth concerns[2]. With the US-China trade war deepening with no end in sight, evidence is starting to mount that global trade has started to cool off. The US is not immune to this trend either: after posting a 3.2% annualized growth rate in Q1’19, the Atlanta Fed GDPNow growth tracker sees Q2’19 US GDP in at 1.3%.
While the geopolitical backdrop is already tense given conflicts between the US and Iran, rising oil inventories have been the predominant force driving energy markets in recent weeks. The most recent oil inventory report for the week ended May 17 showed a larger than expected build in supplies, with crude oil inventories jumped by 4740K barrels versus an expected decline of -1283K.
With the fundamental backdrop proving precarious in the near-term, the technical outlook for crude oil prices has become treacherous as well. In our last update, we warned of a potential bearish outside engulfing bar[3] forming on the weekly timeframe; this manifested with a close below 60.63 last Friday. As longer-term technical signals suggest more weakness ahead, the daily chart suggests that momentum is firmly pointed to the downside at present time.
Crude Oil Technical Analysis: Daily Price Chart (April 2018 to May 2019) (Chart 1)
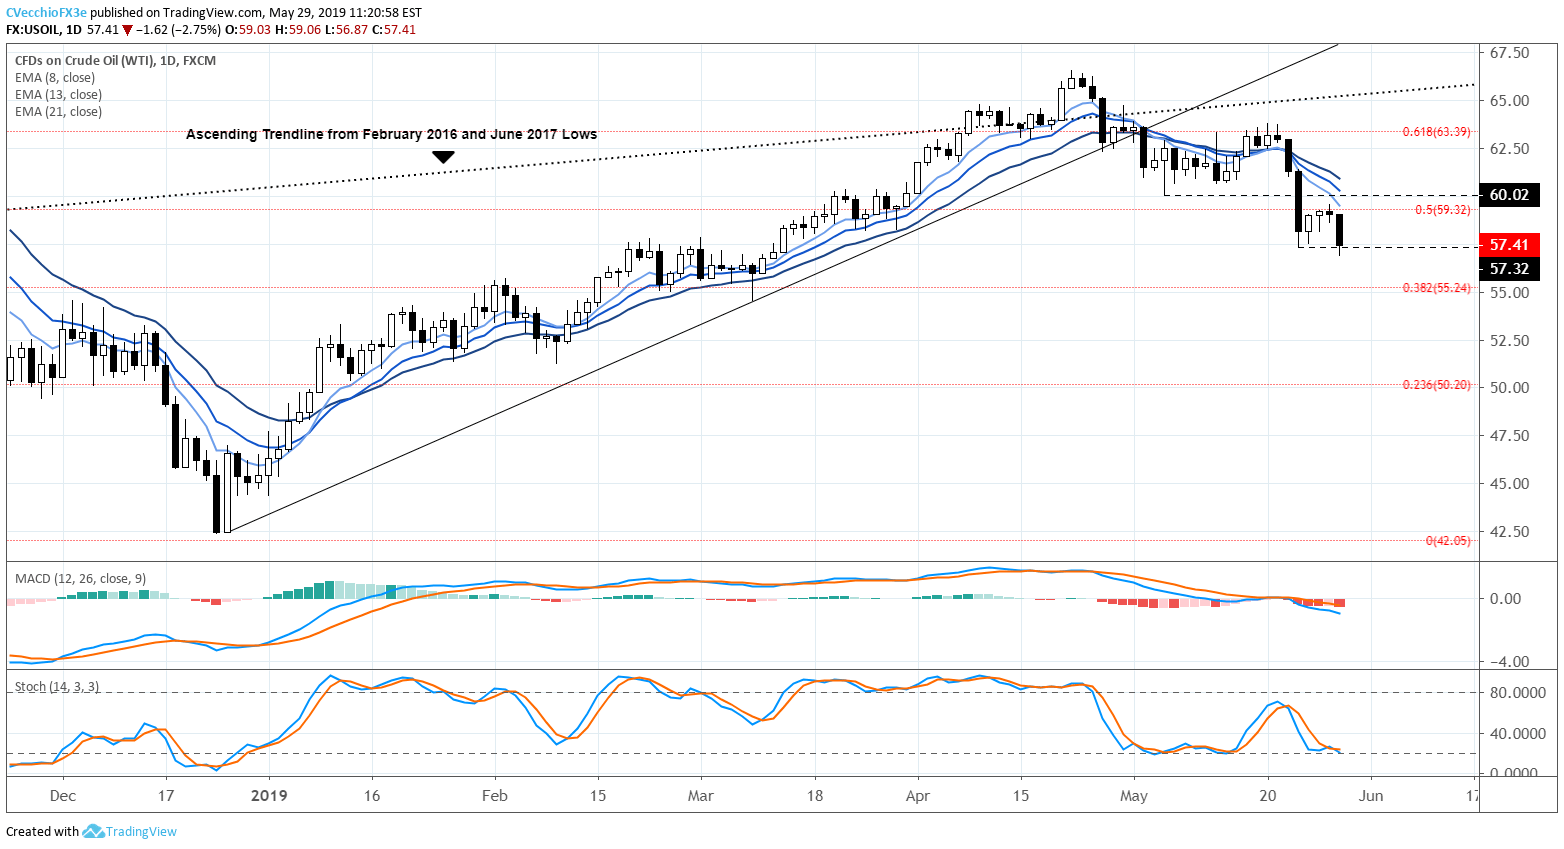
The daily price chart showcases the firming bearish momentum in crude oil prices. Extending further below its daily 8-, 13-, and
