

The New Zealand Dollar[1] is down 0.65% against the US Dollar[2] since the start of the month with Kiwi rebounding off key confluence support late-last week. While the near-term picture allows for further gains, the broader risk remains weighted to the downside after breaking multi-year slope support earlier in the month. These are the updated targets and invalidation levels that matter on the NZD/USD[3] charts this week. Review this week’s Strategy Webinar[4] for an in-depth breakdown of this setup and more.
New to Forex[5] Trading? Get started with this Free Beginners Guide[6]
NZD/USD Daily Price Chart
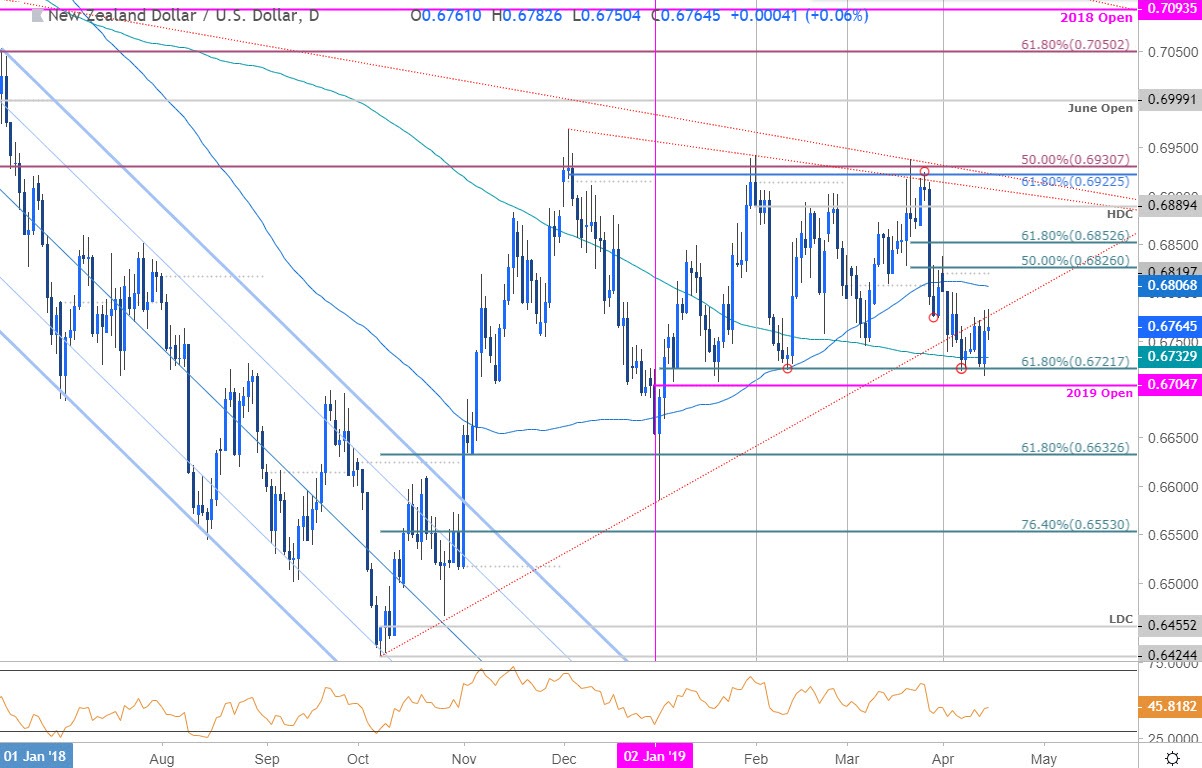
Technical Outlook: In my latest NZD/USD Price Outlook[7] we noted that Kiwi had, “turned from multi-month consolidation resistance and keeps the focus on a reaction just lower near the 2018 trendline. From a trading standpoint, we’ll favor fading weakness while below 6889 - look to reduce short-exposure / possible price exhaustion on a move lower. Ultimately a break below yearly open support at 6705would be needed to validate a larger turn in price.” NZD/USD registered a low at 6713 last week before rebounding with price holding just below former trendline[8] support (now resistance) extending off the 2018 lows.
Note that daily momentum has continued to defend the 40-threshold as support – a break below this level alongside a break below yearly open support at 6705 would be needed to validate the reversal targeting 6633. Initial resistance stands with the 100-day moving average at ~6807 with a breach / close above the monthly open / 50% retracement at
