

The Canadian Dollar[1] is virtually unchanged against the US Dollar[2] for the week as price continues to narrow within the confines of the larger consolidation pattern we’ve been tracking. These are the updated targets and invalidation levels that matter on the USD/CAD[3] charts into the close of the week.
New to Forex[4] Trading? Get started with this Free Beginners Guide[5]
USD/CAD Daily Price Chart
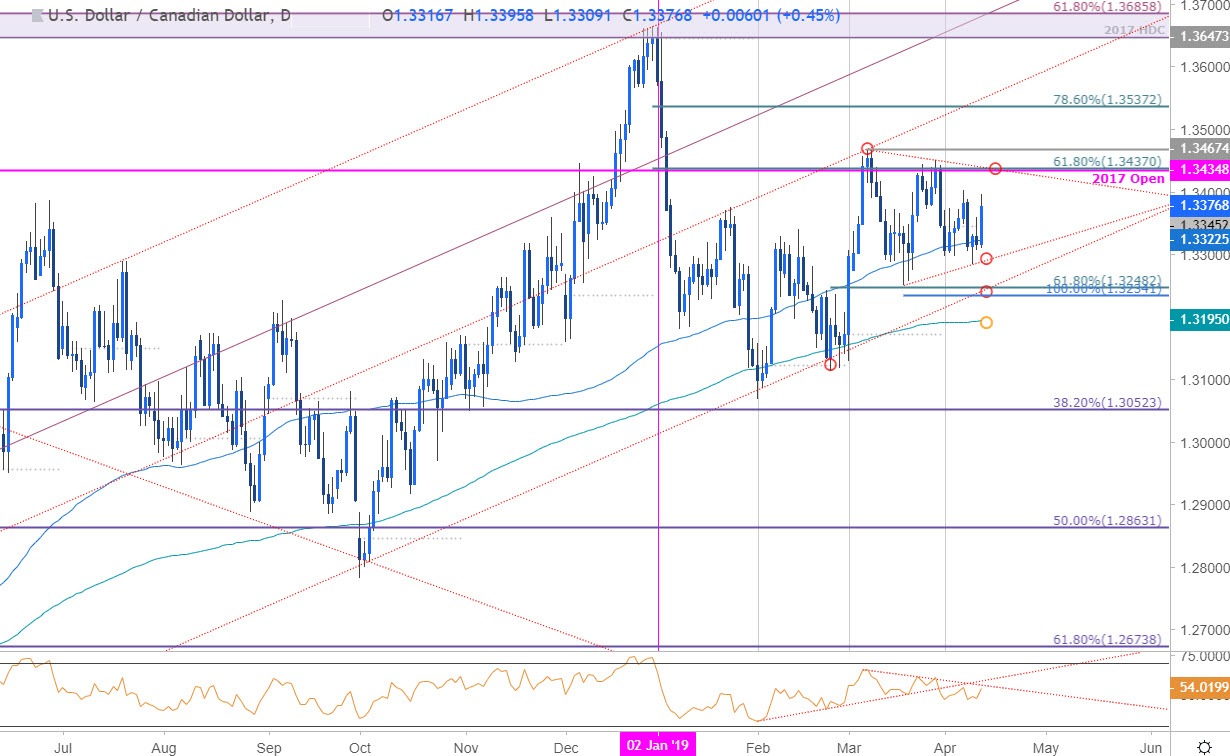
Technical Outlook: In my latest USD/CADWeekly Technical Outlook[6] we noted that price has continued to consolidate just below a critical resistance confluence at 1.3435/37–a region defined by the 61.8% retracement of the 2019 range and the 2017 yearly open. Note that the March trendline also converges on this zone and further highlights its technical significance.
Interim support rests with the March 19th trendline[7] (currently ~1.33) with broader bullish invalidation eyed at 1.3234/48 – a break / close below this threshold would be needed to validate the turn targeting the 200DMA at 1.3195. A topside breach of the formation exposes subsequent resistance objectives at the march highs at 1.3467 backed by the 78.6% retracement[8] at 1.3537.
Why does the average trader lose? Avoid these Mistakes in your trading[9]
USD/CAD 120min Price Chart

Notes: A closer look at Loonie price action shows USD/CAD trading within the confines of a near-term ascending pitchfork formation[10] with the recent advance testing confluence resistance today at 1.3384/87 – where the weekly open, the weekly opening-range highs and
