

The British Pound[1] is down more than 2.5% from the yearly highs against the US Dollar[2] with Sterling trading within the confines of a near-term consolidation pattern just above support. These are the updated targets and invalidation levels that matter on the GBP/USD[3] charts as the Brexit[4] saga continues. Review this week’s Strategy Webinar[5] for an in-depth breakdown of this setup and more.
New to Forex Trading? Get started with this Free Beginners Guide[6]
GBP/USD Daily Price Chart
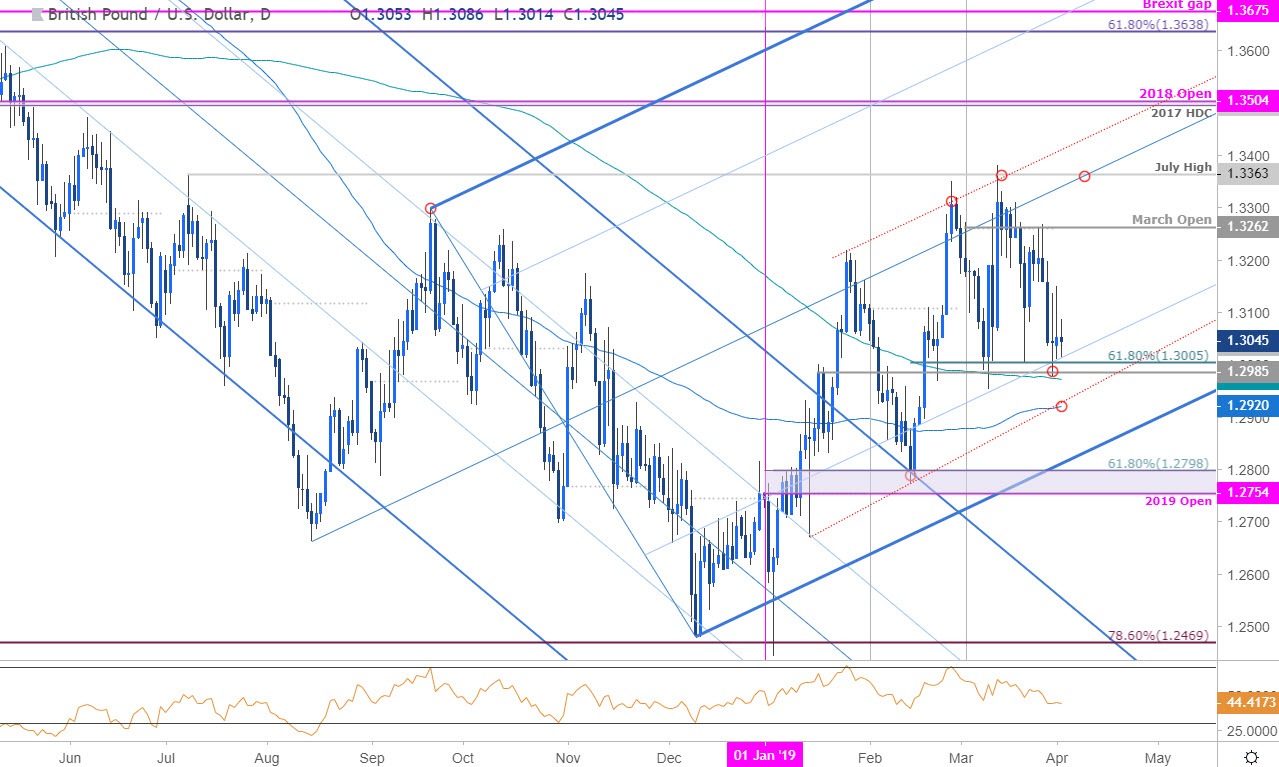
Technical Outlook: In my latest GBP/USD Weekly Technical Outlook[7] we noted that the, “risk remains weighted to the downside heading into the close of the month / quarter but ultimately the broader outlook remains constructive while above yearly open support at 1.2754.” The threat remains for a deeper pullback within the confines of the uptrend with Sterling respecting the March opening-range[8] into the start of 2Q – we’re looking for the break.
Daily support rests at 1.2975-1.3004 – a region defined by the 200-day moving average & the 61.8% retracement[9] of the February advance. A break / close below this threshold would threaten a larger set-back towards the lower parallels. Initial resistance stands at the March open at 1.3262 backed by the median-line / July high at 1.3363 – a breach / close above would be needed to mark resumption.
Learn how to Trade with Confidence in our Free Trading Guide[10]
GBP/USD 240min Price Chart
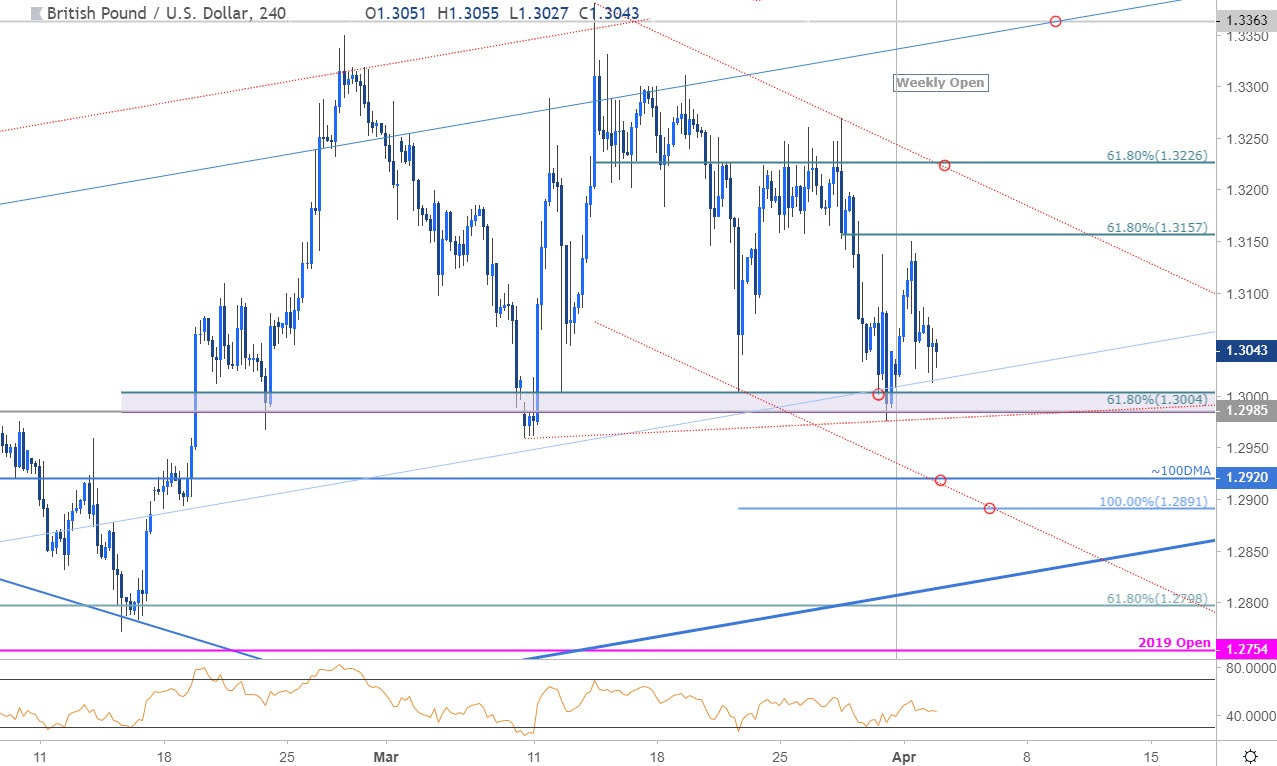
Notes: A closer look at price action shows Sterling trading within the
