

The British Pound[1] is trading in the middle of a 3% range off the February highs with price setting a well-defined March opening-range against the US Dollar[2]. These are the updated targets and invalidation levels that matter on the GBP/USD[3] charts as the Brexit negotiations continue to dominate the major headlines.
New to Forex Trading? Get started with this Free Beginners Guide[4]
GBP/USD Daily Price Chart
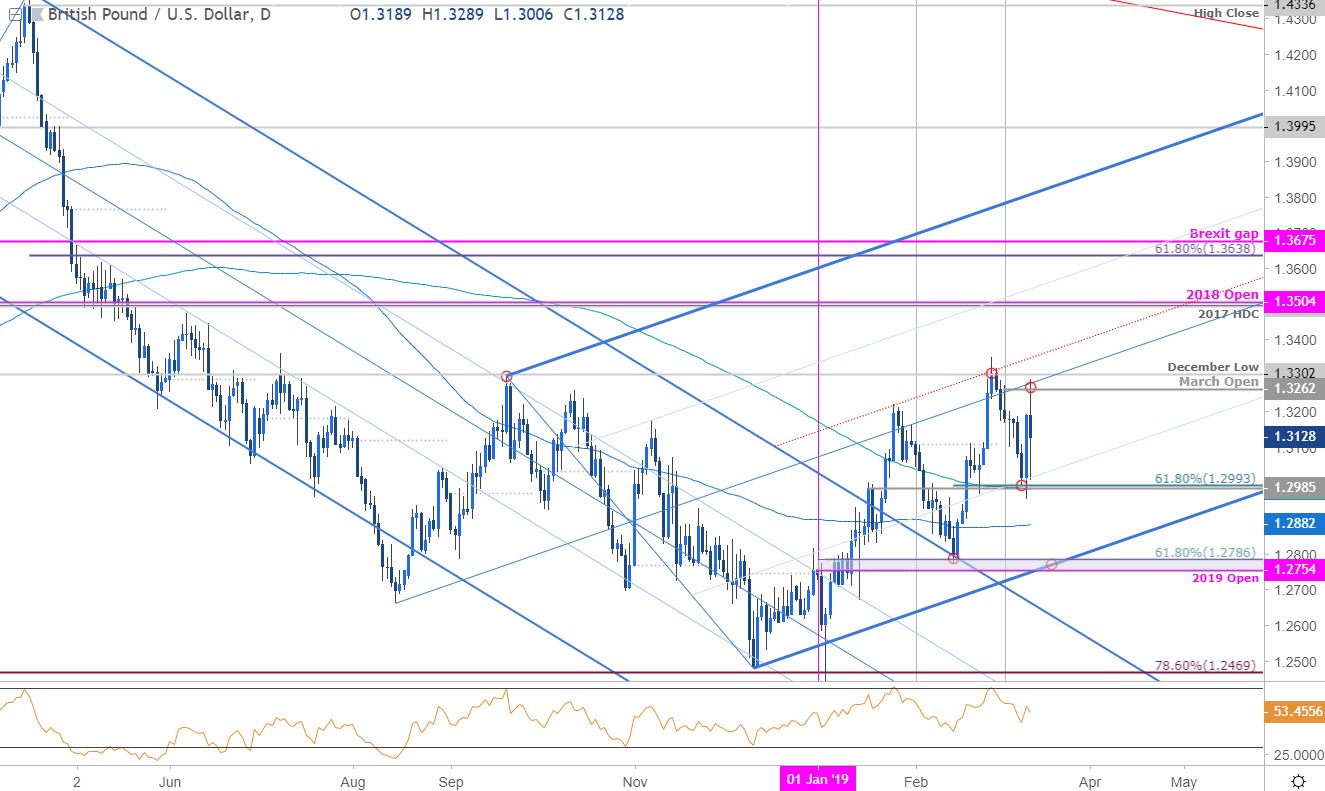
Technical Outlook: In my latest GBP/USD Weekly Technical Outlook[5], we noted that “The threat remains for further loses in the British Pound within the confines of ascending formation we’ve been tracking off the 2018 & 2019 lows.” Sterling dropped into key confluence support at 1.2985/92 (61.8% retracement / 200-day moving average / 25% line) before rebounding sharply with the advance failing just above monthly open resistance yesterday at 1.3262. The move puts the immediate focus on a break of the 1.2985 – 1.3262 range with a breach / close above the December low / February high-day close at 1.3302/07 needed to mark resumption. Broader bullish invalidation for the December advance rests at 1.2754/86.
Learn how to Trade with Confidence in our Free Trading Guide[6]
GBP/USD 120min Price Chart
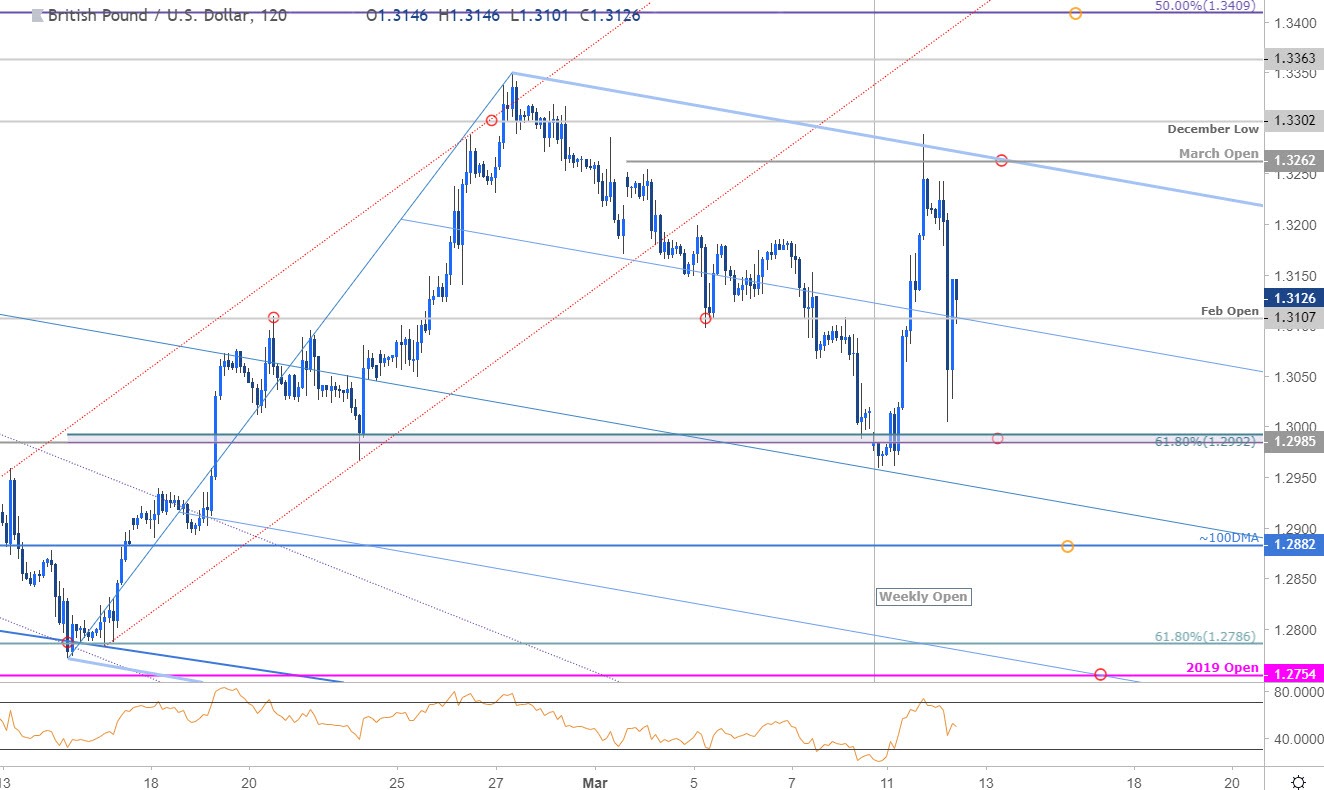
Notes: A closer look at price action shows Sterling trading within the confines of a descending pitchfork formation[7] extending off the January / February high with price briefly probing above the upper parallel this week before turning over. Key support remains at 1.2985/92 with a break lower exposing the 100-day moving average, currently around ~1.2882, and the yearly open
