

The New Zealand Dollar[1] broke below the weekly opening-range[2] low after turning from range resistance yesterday and remains at risk for further losses against the US Dollar[3] heading into the March open. These are the updated targets and invalidation levels that matter on the NZD/USD[4] charts. Review this week’s Strategy Webinar[5] for an in-depth breakdown of this setup and more.
New to Forex Trading? Get started with this Free Beginners Guide[6]
NZD/USD Daily Price Chart
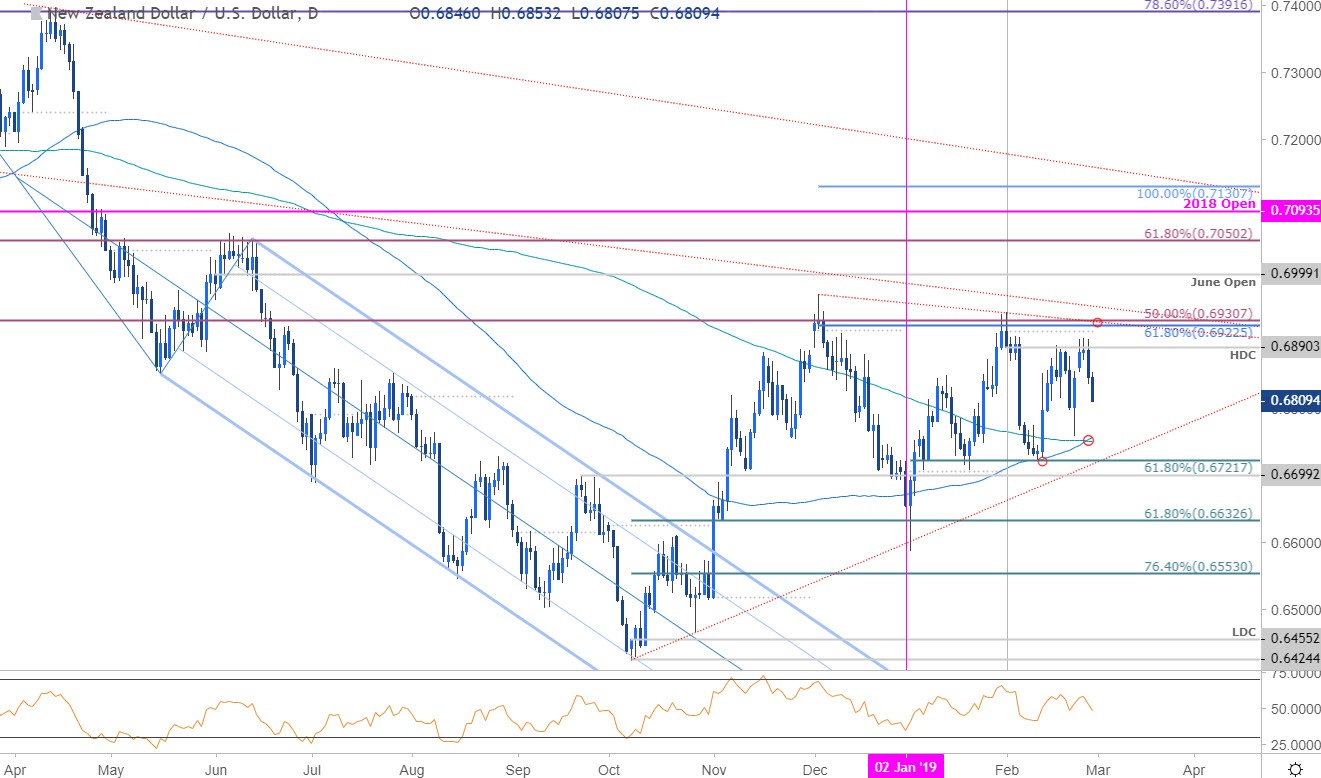
Technical Outlook: In my latest NZD/USD Weekly Technical Outlook[7] we noted that Kiwi had, “carved out an even clearer range between 6707-6941 and the focus heading into the close of the month is on a break of this range.” Price posted a reversal candle off the yearly high-day close at 6890 yesterday with momentum failing ahead of the 60-threshold (typically bearish).
Daily support is eyed at the confluence of the 100 & 200-day moving averages at 6750/56 backed by the 61.8% retracement[8] of the yearly range / 2018 trendline[9] support at ~6722 (area of interest for possible exhaustion / long entries IF reached). A close below 6700 would validate a break of the 2019 consolidation range with such a scenario exposing 6633. Key resistance / broader bearish invalidation steady at 6922/31.
Learn how to Trade with Confidence in our Free Trading Guide[10]
NZD/USD 120min Price Chart
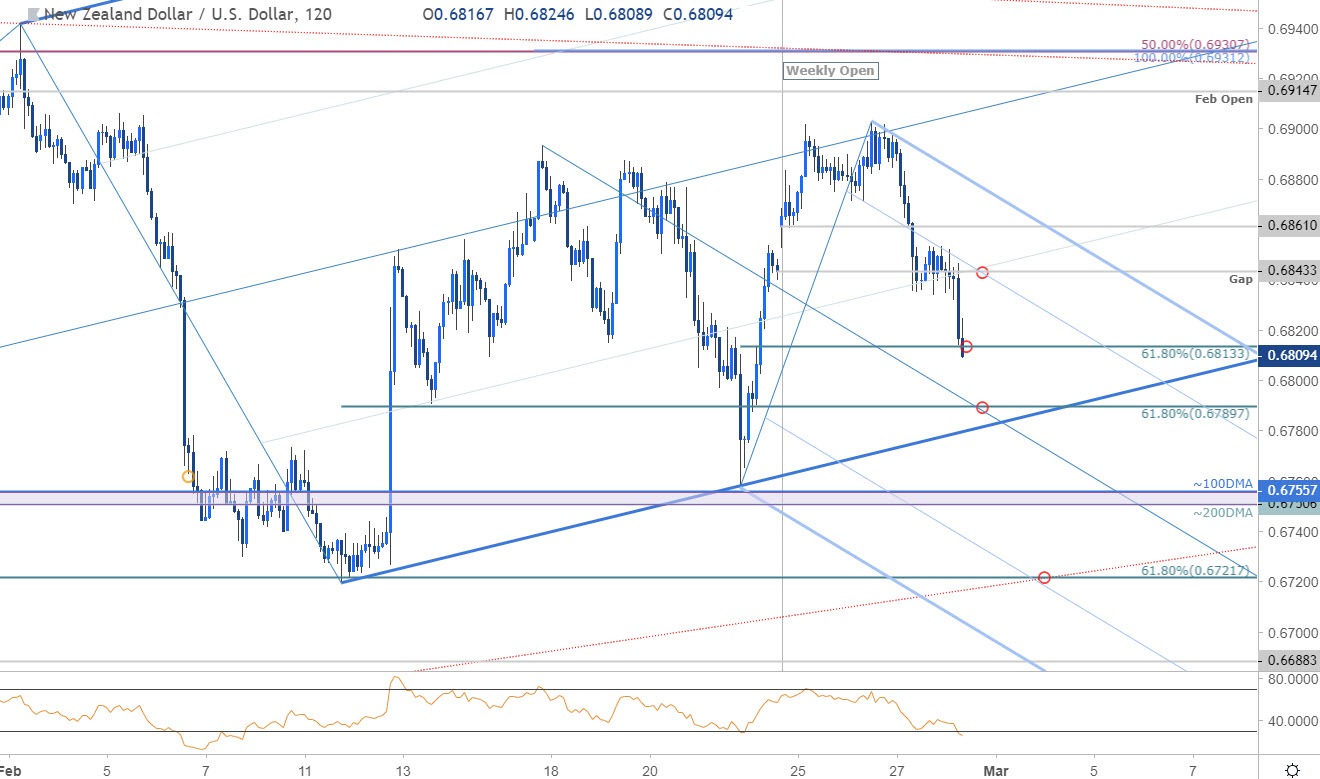
Notes: A closer look at price action shows Kiwi turning rom the
