

In this series we scale-back and look at the broader technical picture to gain a bit more perspective on where we are in trend.Crude Oil[1] is down more than 2.7% from the weekly open with price now testing key near-term support - here are the key targets & invalidation levels that matter on the WTI weekly chart.
New to Oil Trading? Get started with this Free How to Trade Crude Oil Beginners Guide[2]
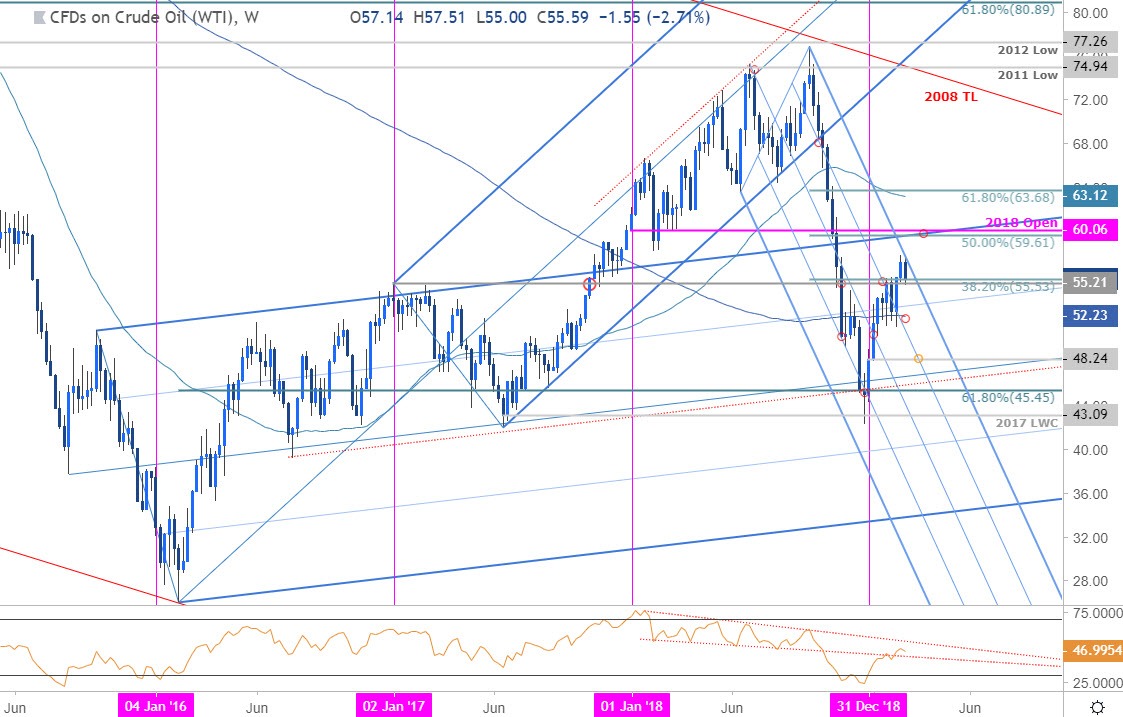
Crude Oil Weekly Price Chart (WTI)
Notes: In last month’s Crude Oil Weekly Technical Outlook[3] our ‘bottom line’ noted that we were, “looking for support on a larger pullback towards the median-line to offer more favorable long-entries with our broader focus weighted to the topside while above 46.91.” Price registered a low at 51.22 before breaking through resistance at the monthly opening-range[4] highs with the advance turning from pitchfork resistance early this week.
Immediate support is eyed here at the 55.21/53 pivot zone- a break / close below would threaten a larger decline targeting the 200-week moving average at ~52.23 with critical support eyed at 48.24. A topside breach of this formation / the high-day close at 57.14 targets more a more significant resistance confluence at 59.61-60.06 where the 50% retracement of the October decline and the 2018 open converge on the 2015/ 2016 pitchfork[5] resistance- look for a larger reaction there IF reached. A weekly close above would be needed to suggest that a more meaningful low was registered in December with such a scenario targeting the 52-week moving average / 61.8%
