

Stock Market Talking Points:
Dow Jones Breaches 26,000
Last week I highlighted the crossroads at which the Dow Jones traded.[1] Since then, not much has changed from a price perspective and fund flows remain relatively muted. That said, next week’s loaded economic calendar could put an end to the recent calm in fund flows activity.
Dow Jones Price Chart: Daily Timeframe (January 2018 to February 2019) (Chart 1)

Learn key tips and strategies to day trade the Dow Jones[2]
February Fund Flows Remain Calmed
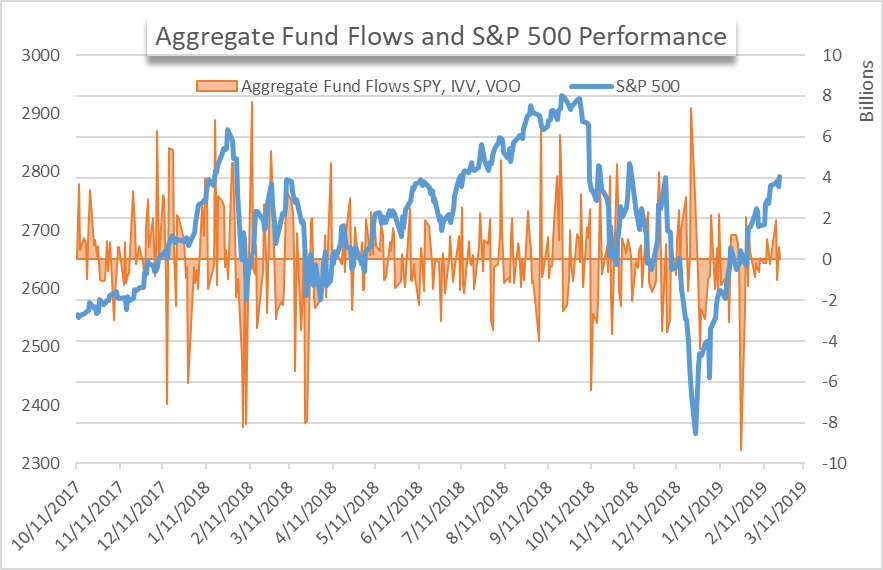
Exchange traded funds SPY, IVV and VOO notched just $373 million in cumulative net inflows this week, with particularly strong buying on Tuesday. While a larger change than last week, the activity still falls short of the record flows witnessed in late January.[3] The relatively deadlocked buying and selling suggests investors are still uncertain about the current landscape of the US equity sector.
Aggregate Fund Flows for Broad Market ETFs versus S&P 500 (Chart 2)
Short-Term Fixed Income Continues to Slide
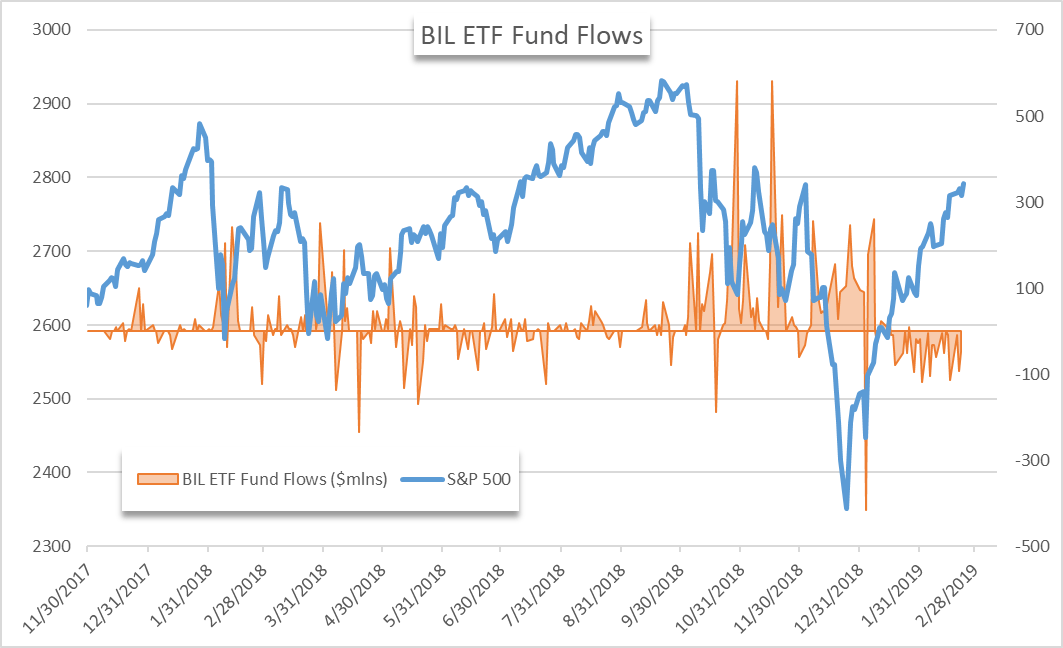
Conversely, investors seem confident about the state of short-term fixed income. The BIL ETF which was also highlighted last week has continued its trend this week. The fund has recorded nearly a month’s worth of consecutive daily outflows. This week alone it saw another $145 million leave its coffers. The reallocation bumps the total capital lost during its streak to nearly $840 million.
BIL ETF Fund Flows (Chart 3)
High Yield Corporate Debt sees Continued Demand
The HYG ETF, a fund that tracks the performance of high yield fixed income, notched another week of net inflows. After over $400 million in inflows this week, the fund has seen roughly $1.2 billion in fresh capital enter
