

The Australian Dollar[1] rallied nearly 1.7% against the US Dollar[2] from the monthly lows with price now targeting a major pivot zone. While the immediate advance may be vulnerable the broader picture remains constructive heading into Australian employment data later tonight. These are the updated targets and invalidation levels that matter on the AUD/USD charts.
New to Forex Trading? Get started with this Free Beginners Guide[3]
AUD/USD Daily Price Chart
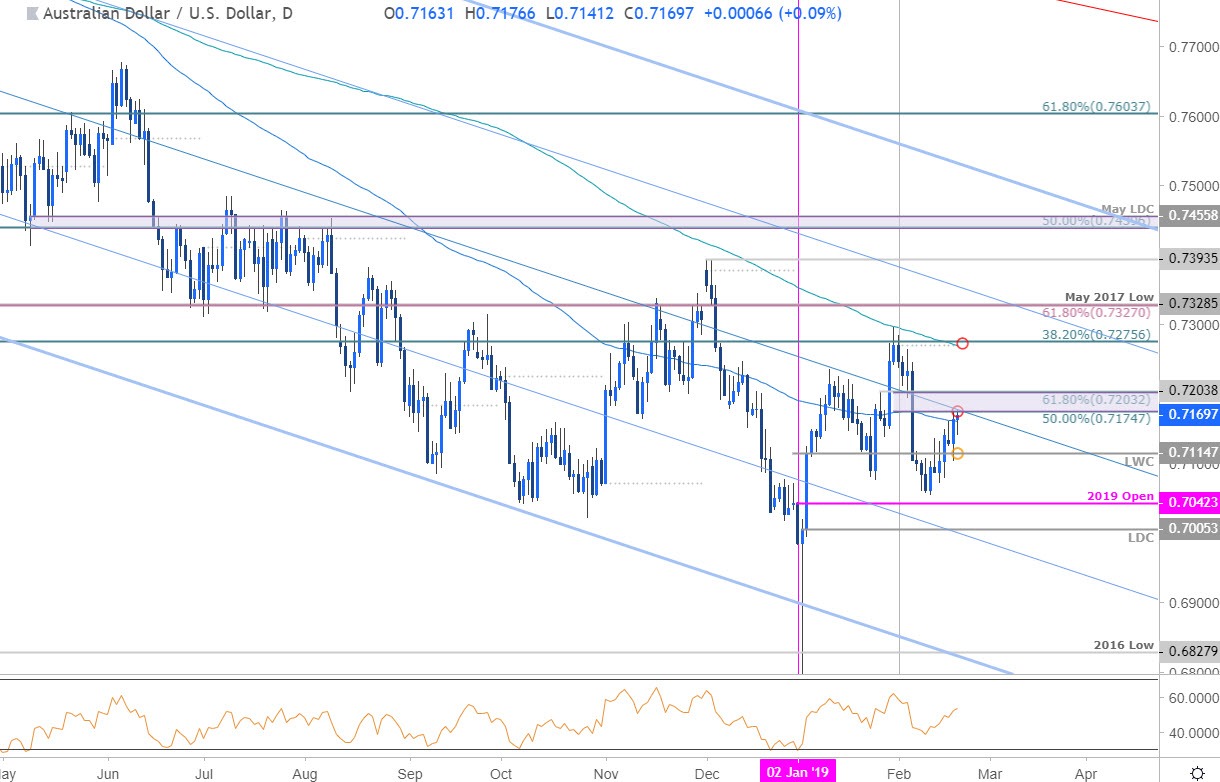
Technical Outlook: AUD/USD has posted 3.2% monthly opening-range[4] with price turning just pips from yearly open support at 7042 last week. The advance is now approaching a critical resistance zone at 7175-7200 where the 50% & 61.8% retracement of the late-January decline converge on the median-line of the broader descending pitchfork formation[5] we’ve been tracking off the 2017 / 2018 highs.
A daily close above this threshold is needed to fuel the next leg higher in price with such a scenario targeting more significant resistance at 7270/76- a region defined by the February open, the 200-day moving average and the 38.2% retracement[6] of the 2018 decline. Daily support rest with the low-week close at 7115- weakness beyond this level would invalidate the reversal play.
Learn how to Trade with Confidence in our Free Trading Guide[7]
AUD/USD 120min Price Chart
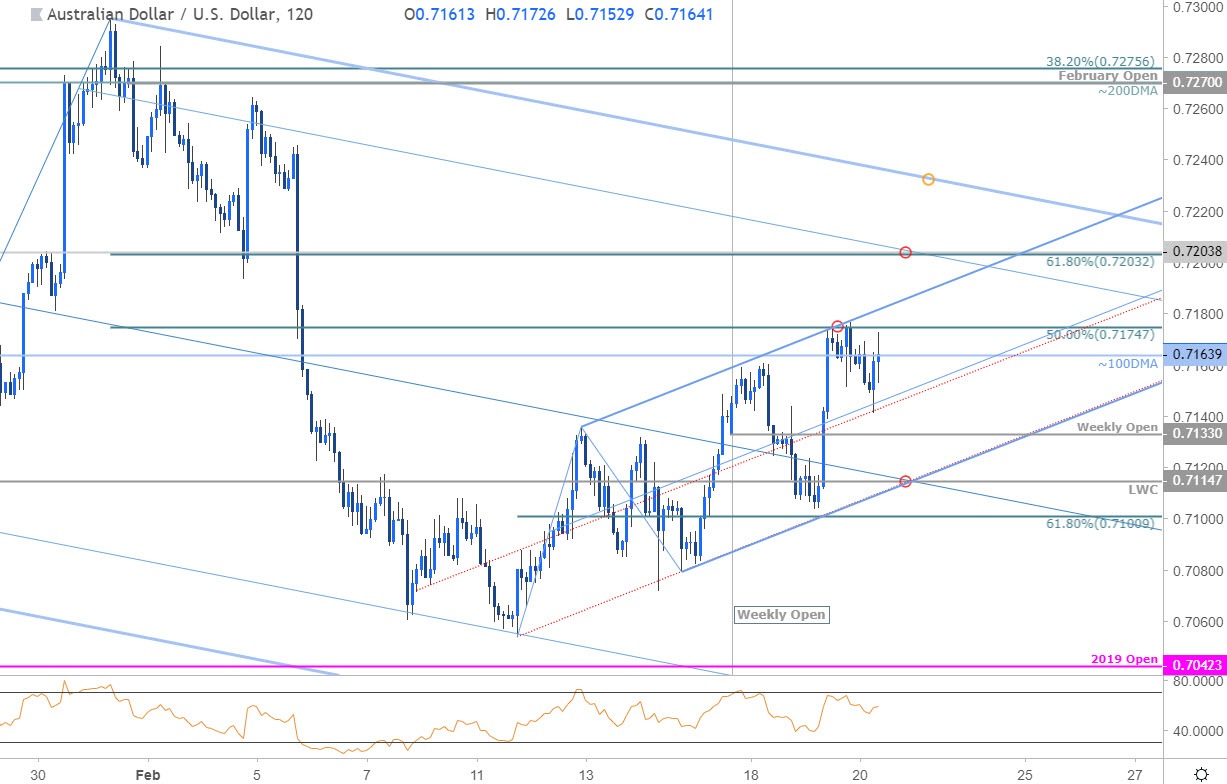
Notes: A closer look at price action shows Aussie trading within the confines of an ascending pitchfork extending of the monthly lows. Price is probing near-term resistance here at 7175 with the upper parallel just higher around ~7185. A breach
