

Gold prices have continued to march higher after breaking through resistance last week with the precious metal already up more than 1.1% since the Sunday open. Here are the key targets & invalidation levels that matter on the Gold (XAU/USD) weekly chart.
New to Gold Trading? Get started with this Free How to Trade Gold -Beginners Guide[1]
Gold Weekly Price Chart (XAU/USD)
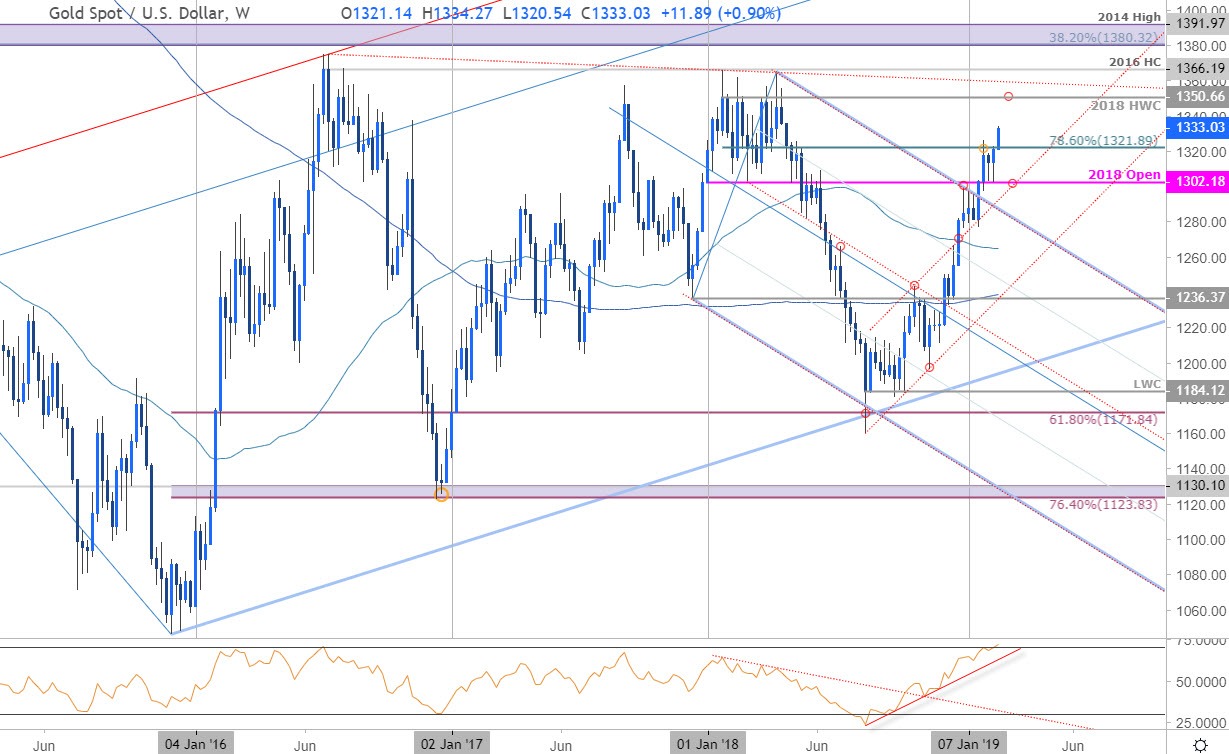
Notes: In my previous Gold Weekly Technical Outlook[2] we noted that the, “immediate focus is on a break of the 1302-1322 zone early in the month with the broader outlook weighted to the topside while above 1290. From a trading standpoint, we’ll favor fading weakness while above confluence support targeting a breach higher in price.” Bullion registered a low at 1302 last week before reversing sharply higher with the advance breaking through Fibonacci[3] resistance at 1322 early in the week. Note that weekly RSI has is now probing into overbought territory – watch the close this week for guidance with a hold above needed to keep the immediate the long-bias viable.
Look for initial support at the weekly open at 1321 with bullish invalidation now raised to 1302. Weekly resistance stands at the 2018 high-day & high-week closes at 1348/50backed closely by the 2016 trendline[4] just higher around ~1360s.
For a complete breakdown of Michael’s trading strategy, review his Foundations of Technical Analysis series on Building a Trading Strategy[5]
Bottom line:The focus is higher while above 1302 with price now approaching
