

Stock Market Talking Points:
- Minimal changes in index tracking funds could show indecision, or interest elsewhere
- The T-bill tracking ETF BIL has recorded consecutive outflows for over three weeks
- See Q1’19 forecasts for the Dow[1], Dollar, Bitcoin[2] and more with the DailyFX Trading Guides[3].
Dow Jones Drives Higher in February
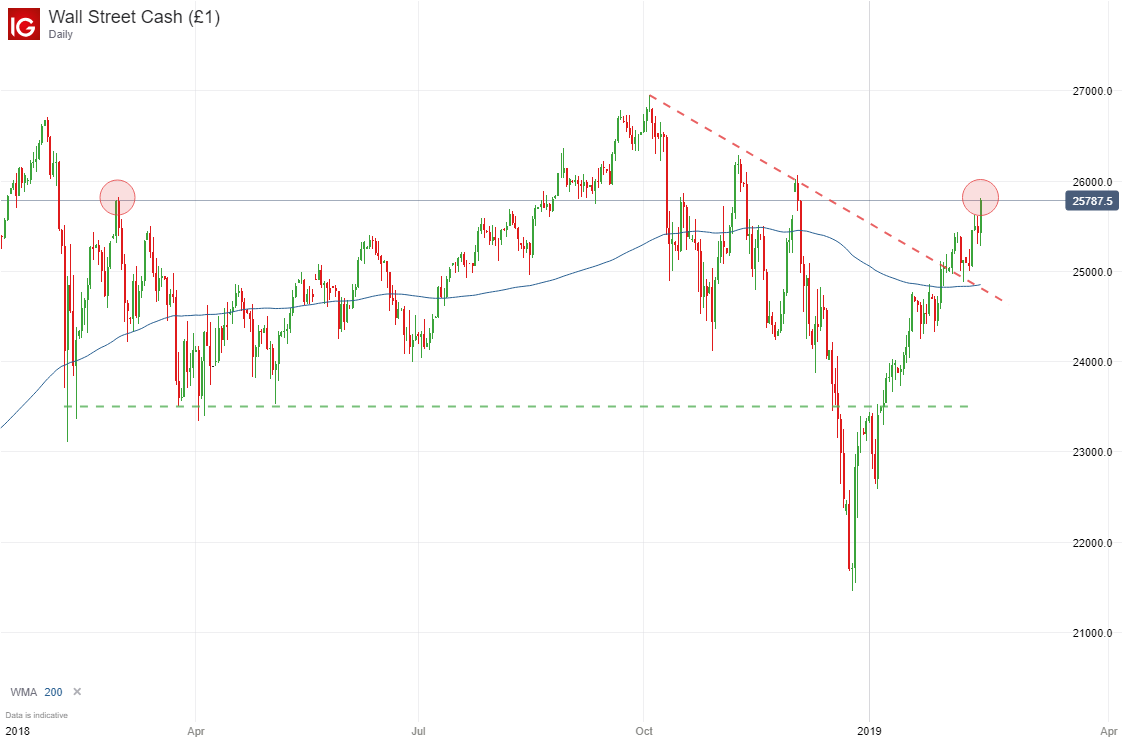
The Dow Jones[4] has continued its journey higher in February after a stellar January. As of Friday, the Industrial Average closed around 25,880 following optimism on the trade war talks between the United States and China. Technically speaking, the index rests near swing highs registered in early 2018 and mid-October. Sustained optimism next week could see the Dow clear the level, thus opening up higher price targets. With that in mind, exchange traded fund flows reveal mild inflows amidst such a sustained rally.
Dow Jones Price Chart: Daily Time-frame (January 2018 to February 2019) (Chart 1)
Learn key tips and strategies to day trade the Dow Jones[5]
February Sees Muted Fund Flows
After the last week of January delivered a record intraday outflow for the funds included in this series,[6] February has failed to offer any flows as surprising. However, that is not to say there have been no noteworthy developments at all. Thus far the month of February has seen a net outflow of a meager $740 million, considerably lower than the single outflow highlighted two weeks ago. While the aggregate fund flows have been muted with no discernible trend, the same cannot be said for other areas in the ETF space, namely short-term fixed income.
