

In this series we scale-back and look at the broader technical picture to gain a bit more perspective on where we are in trend. Despite early-year volatility, the US Dollar[1] is virtually unchanged against the Japanese Yen[2] with price trading within a well-defined range just below the yearly moving-average. Here are the key targets & invalidation levels that matter on the USD/JPY[3]weekly chart.
New to Forex Trading? Get started with this Free Beginners Guide[4]
USD/JPY Weekly Price Chart (log)
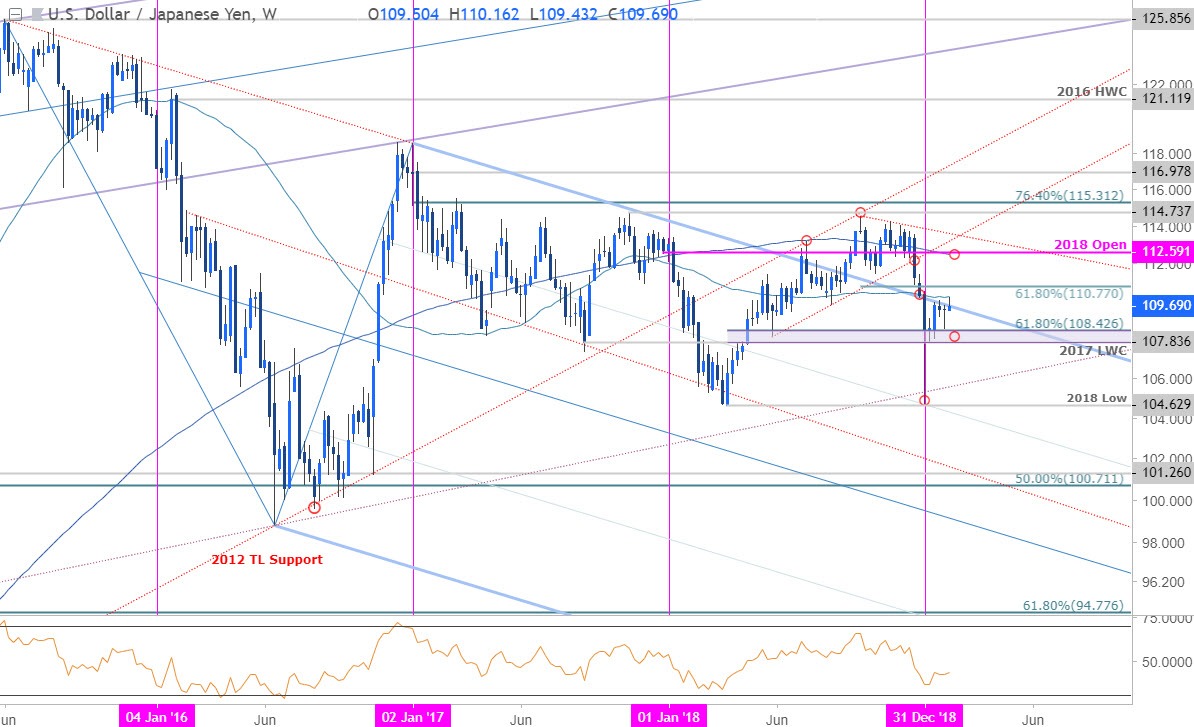
Notes: USD/JPY[5] collapsed into the close of 2018 with price briefly testing the yearly range lows in early January before rebounding sharply. Note that price has continued to respect (weekly close basis) a critical support zone at 107.84 - 108.43– a region defined by the 2017 low-week reversal close and key the 61.8% retracement[6] of the 2018 range.
Initial weekly resistance stands with the 2015 trendline[7] (blue) backed closely by the 52-week moving average at ~110.20s. A breach / close above this zone is needed to suggest a more significant low was registered last month with such a scenario targeting the 61.8% retracement of the decline at 110.77 backed by the 200-week moving average / 2018 yearly open at 112.45/59. A downside break of this range targets 106.75 and the 2013 trendline (red).
For a complete breakdown of Michael’s trading strategy, review his Foundations of Technical Analysis series on Building a Trading Strategy[8]
Bottom line: USD/JPY has continued to
