

Gold prices[1] broke above technical resistance last week and while the broader focus in price remains weighted to the topside, the advance is approaching levels which may limit the rally near-term. These are the updated targets and invalidation levels that matter on the XAU/USD[2] charts.
New to Gold Trading? Get started with this Free How to Trade Gold -Beginners Guide[3]
Gold Daily Price Chart (XAU/USD)
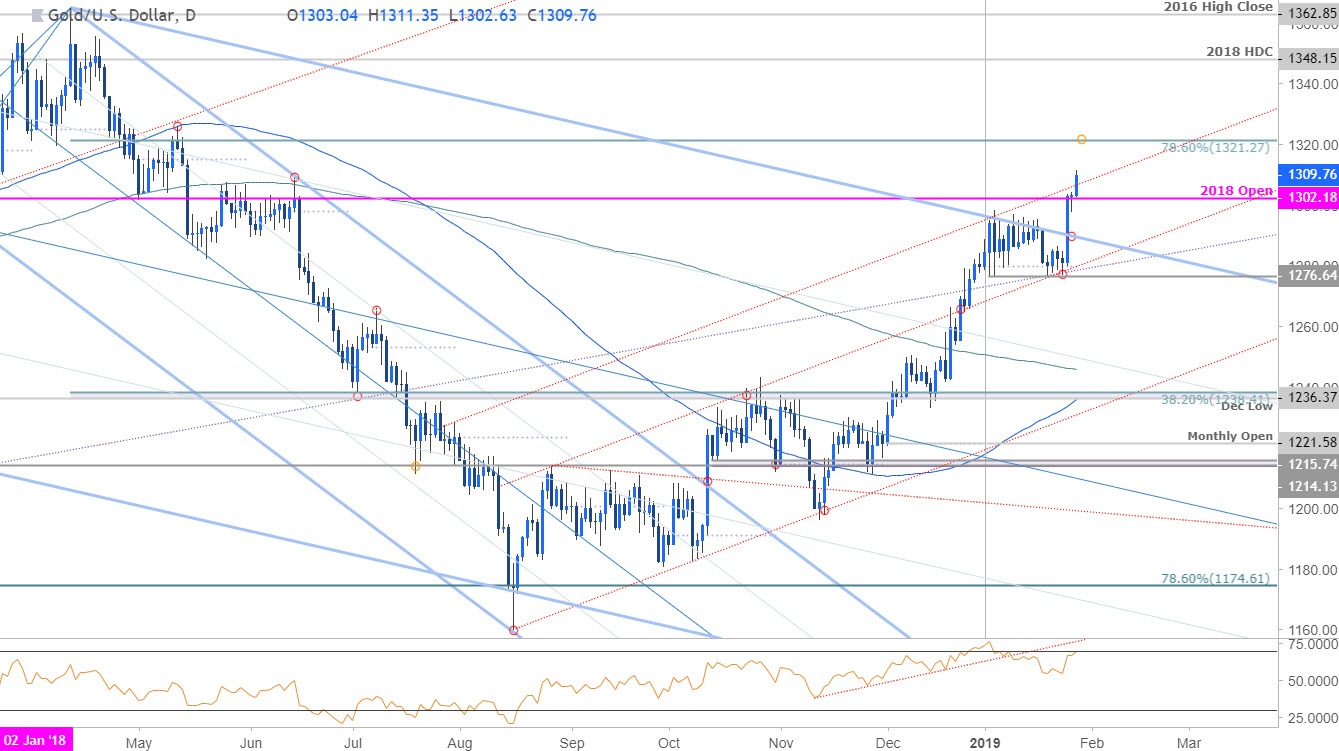
Technical Outlook: In my latest Gold Weekly Technical Outlook[4] we note that the rally was approaching the first major threshold of resistance with, “a close above the 2018 open at 1302 to validate a larger breakout in price.” Price broke above the January opening-range[5] on Friday with the advance taking bullion through 1302 early in the week.
The focus is on a daily close above this parallel (red) with subsequent resistance objectives eyed at the 78.6% retracement[6] of the 2018 range at 1321. Initial support rests at former slope resistance (currently ~1286) with broader bullish invalidation at the monthly range lows at 1276.
Why does the average trader lose? Avoid these Mistakes in your trading[7]
Gold 120min Price Chart (XAU/USD)
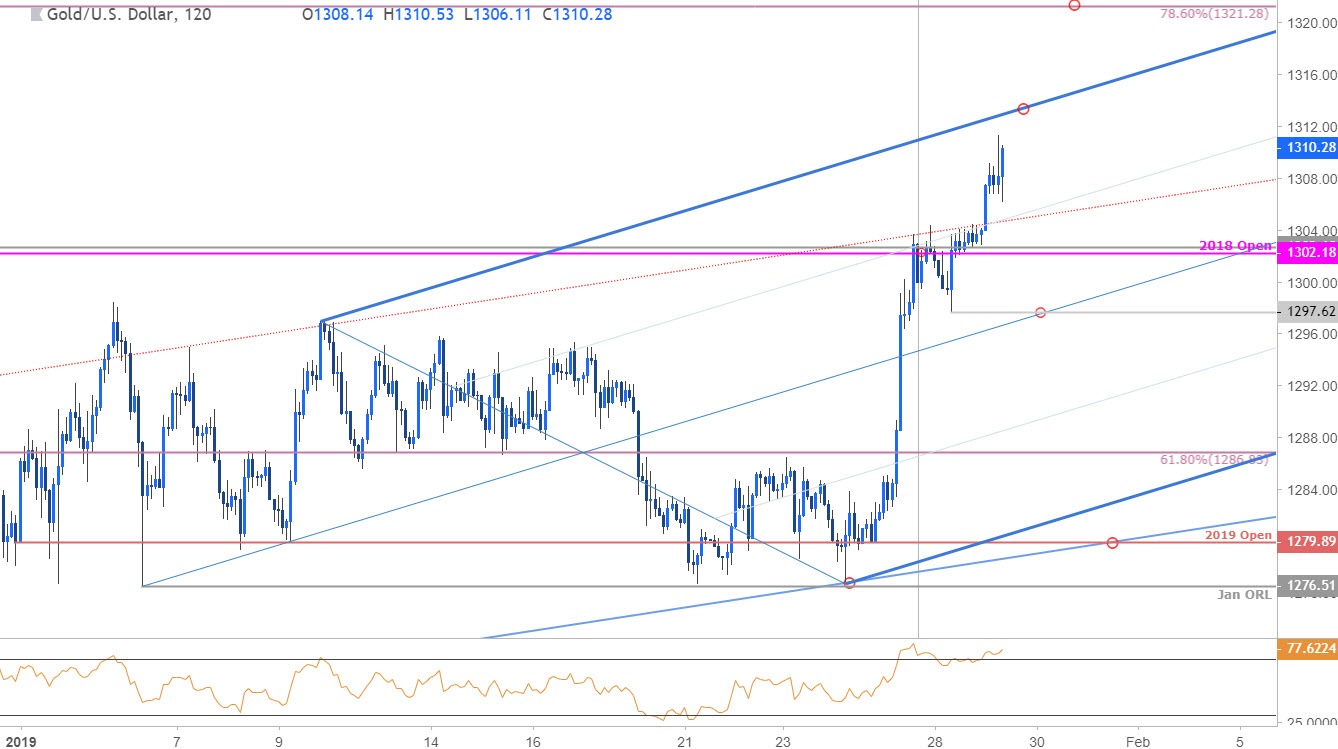
Notes: A closer look at price action shows gold trading within the confines of an ascending pitchfork[8] formation extending off the January lows with bullion trading just below the upper median-line parallel around ~1313 today in New York trade (blue). The advance is at risk near-term heading into this region with initial support back at the weekly open at 1302. Near-term bullish invalidation rests at
