

In this series we scale-back and look at the broader technical picture to gain a bit more perspective on where we are in trend. Crude Oil[1] is on the defensive to start the week with price pulling back from six-week highs after rally of more-than 18.7% from the yearly / monthly open. While the threat of more near-term losses remains, the broader outlook remains constructive - here are the key targets & invalidation levels that matter on the WTI weekly chart.
New to Oil Trading? Get started with this Free How to Trade Crude Oil Beginners Guide[2]
Crude Oil Weekly Price Chart (WTI)
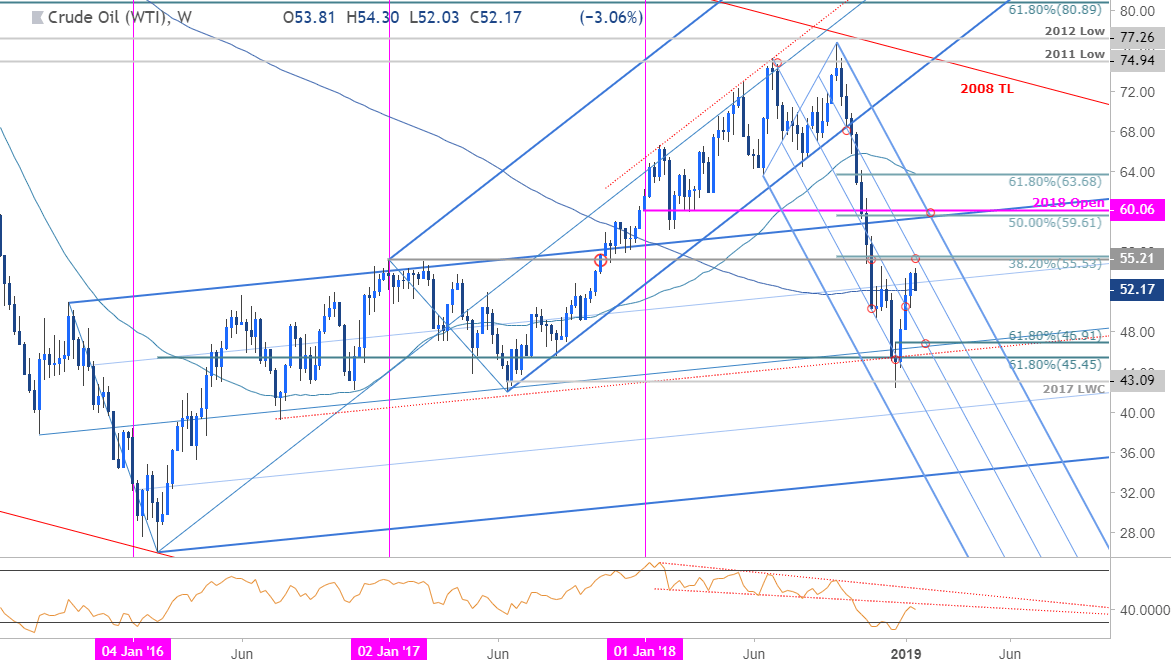
Notes: In our previous Crude Oil Weekly Technical Outlook[3] we noted that prices had rebounded from a critical support confluence with the advance targeting initial pitchfork resistance around ~50.49. “A breach above the median-line[4] would be needed to suggest a more significant near-term low is in place with such a scenario targeting the 200-week moving average at ~52.12 and the confluence resistance zone at 55.21/53.” Crude broke higher in the following days with the advance surpassing the 200-week moving average last week.
The rally failed just ahead of confluence resistance with prices poised to register an outside-daily reversal today in New York. The immediate threat is for further losses here, but the broader outlook remains constructive while above the 61.8% retracement of the December advance at 46.91. Initial support rests at the median-line at ~48.32. Topside resistance objectives remain unchanged with a breach above 55.21/53 needed to fuel the next leg higher targeting critical confluence
