

The Australian Dollar[1] has rallied more than 6.6% against the US Dollar[2] off the early-January low with the advance looking vulnerable just below technical resistance. These are the updated targets and invalidation levels that matter on the AUD[3]/USD charts. Review this week’s Strategy Webinar[4] for an in-depth breakdown of this setup and more.
New to Forex Trading? Get started with this Free Beginners Guide[5]
AUD/USD Daily Price Chart
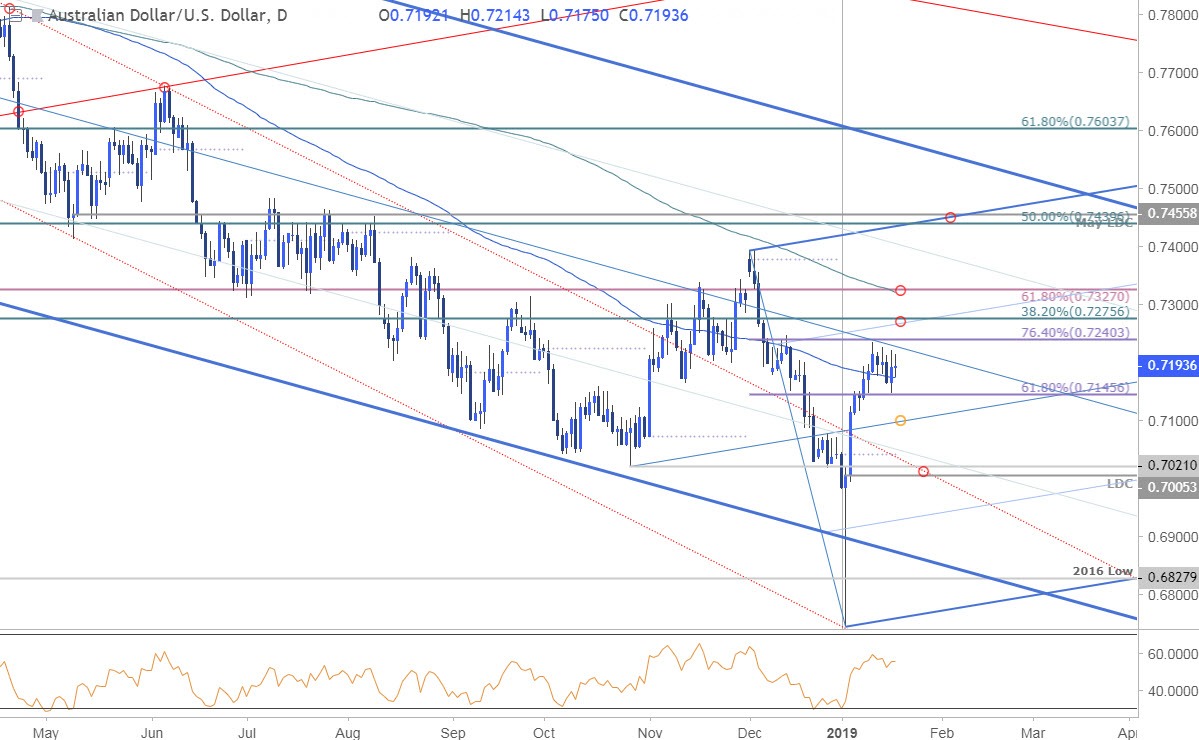
Technical Outlook: In my latest AUD/USD Weekly Technical Outlook[6] we noted that Aussie reversal was, “approaching the first major resistance hurdle, and a make-or-break pivot just higher near 7240s – look for a reaction there IF reached.” Price registered a high at 7235 last Friday before pulling back with Aussie drifting sideways this week. The risk remains for a deeper pullback here but ultimately, we’re looking for more favorable long-entries on a move lower.
Daily support rest at 7145 backed by the median-line of the proposed pitchfork[7] extending off the 2018 / 2019 lows with broader bullish invalidation at 7005/21. A topside breach targets subsequent resistance objectives at 7276 and the 200-day moving average / 61.8% retracement[8] at 7322/27.
Learn how to Trade with Confidence in our Free Trading Guide[9]
AUD/USD 240min Price Chart
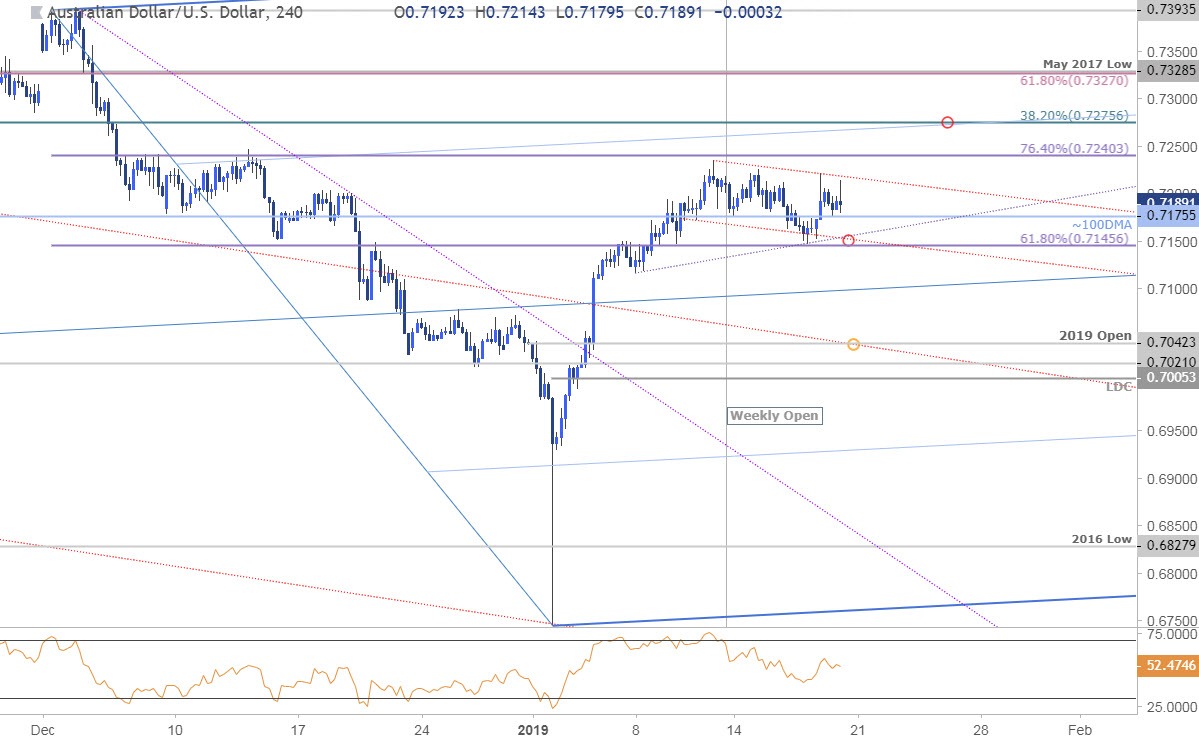
Notes: A closer look at price action show AUD/USD[10] trading within a tight range this week just above near-term support at 7145. A break below this level would risk a larger setback in
