

The British Pound[1] has rallied more than 3.7% against the US Dollar[2]off the monthly lows despite a steady stream of Brexit headlines. The advance takes price into a critical resistance zone that if broken, would shift the broader focus higher in Sterling. These are the updated targets and invalidation levels that matter on the GBP[3]/USD charts. Review this week’s Strategy Webinar[4] for an in-depth breakdown of this setup and more.
New to Forex Trading? Get started with this Free Beginners Guide[5]
GBP/USD Daily Price Chart
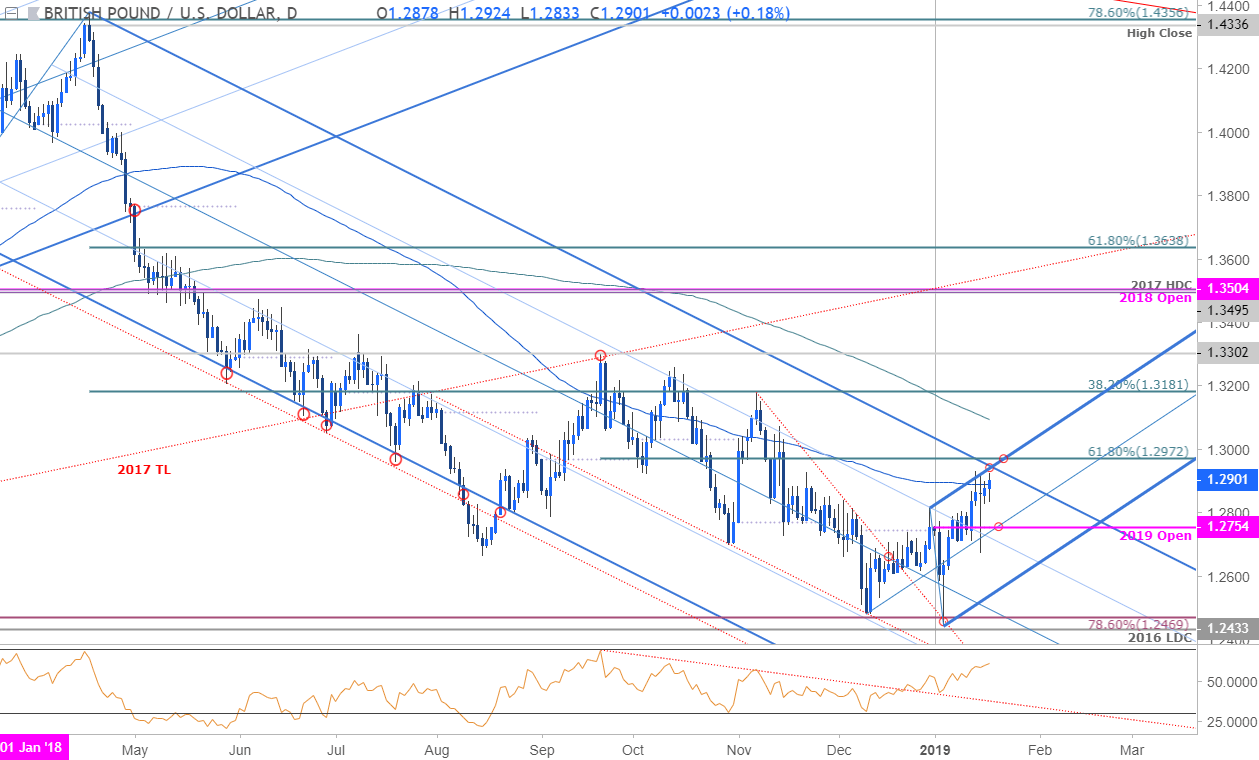
Technical Outlook: In my latest GBP/USD Weekly Technical Outlook[6] our ‘bottom line’ noted that Sterling was, “losing steam just ahead of broader down-trend resistance and leaves the immediate recovery at risk while below 1.2972.” This level is defined by the 61.8% retracement of the September decline and converges on near-term uptrend & longer-term downtrend pitchfork resistance. A breach / close above this barrier is needed to validate the breakout and suggest that a more significant low was registered earlier this month. Yearly open support rests at 1.2754 with a break below the January opening-range lows needed to mark resumption of the broader downtrend.
Learn how to Trade with Confidence in our Free Trading Guide[7]
GBP/USD 240min Price Chart
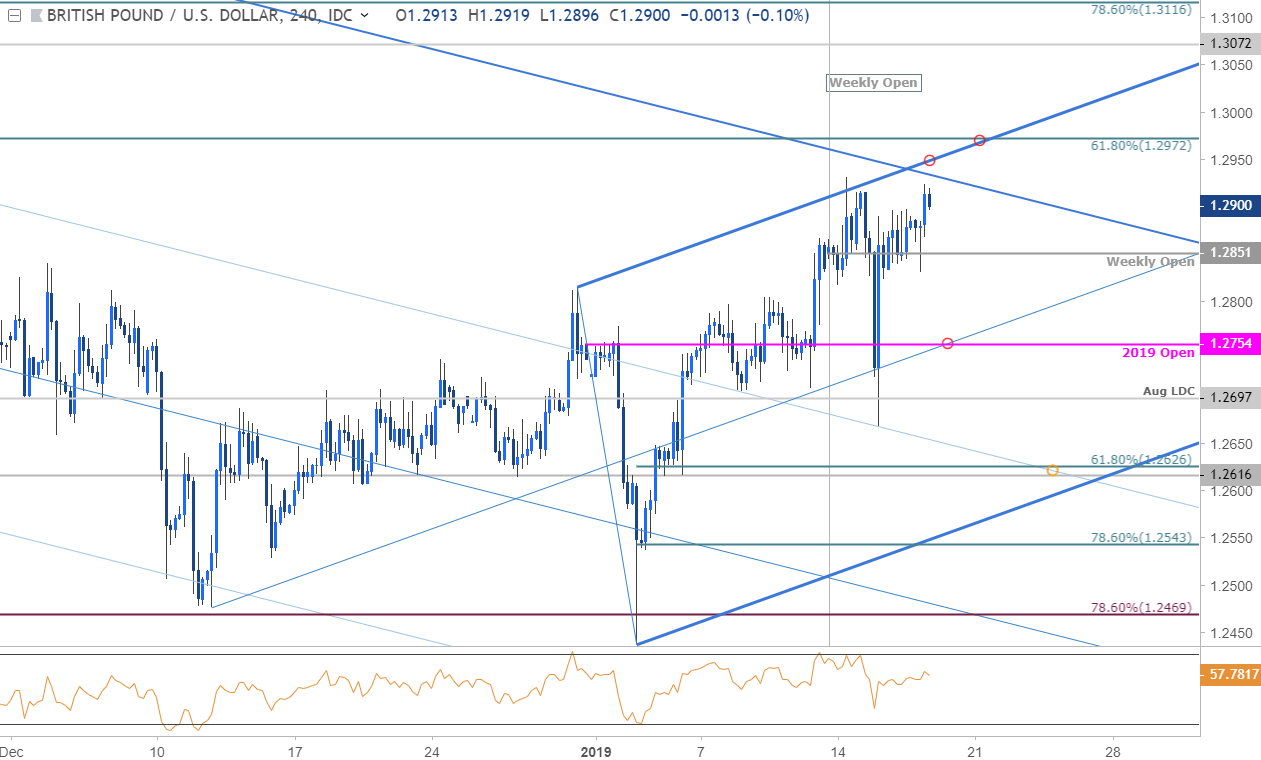
Notes: A closer look at price action shows Sterling trading within the confines of a near-term pitchfork formation extending off the December / January lows with the upper parallel further highlighting the 1.2972 resistance zone. Interim support rests with the weekly open at 1.2851 with near-term bullish invalidation
