

Stock Market Talking Points:
- In late December, SPY, IVV and VOO funds saw assets under management climb the most on an intraday basis since February
- Flows also reveal that many ‘dip-buyers’ are being burned
- Investors shifted more capital in December than in seven of the previous eight months, with October as the outlier
Stock Market Volatility Reflected in ETF Flows
The week was a mixed basket for the US stock market[1]. After Apple revised earnings on Thursday[2], investors were filled with fear of a China slowdown[3]. Luckily for bulls and 401K accounts alike, traders rode positive employment data[4] to a strong close on Friday to end the week 1.86% higher.
S&P 500[5] Price Chart Daily, 2018 to January 4th, 2019 (Chart 1)

Learn to day trade the S&P 500.[6]
According to fund flows from SPY, IVV and VOO, investors bought the dip in earnest on December 21st. $7.4 billion was allocated to the three baskets and marked the largest single day inflow since mid-February 2018 when investors poured nearly $8 billion into the funds on a single day. The inflows preceded a late December rally and some investors were able to pick up some nice profits as others once again reduced their position.
Aggregate Fund Flows for Broad Market ETFs versus S&P 500 Performance (Chart 2)
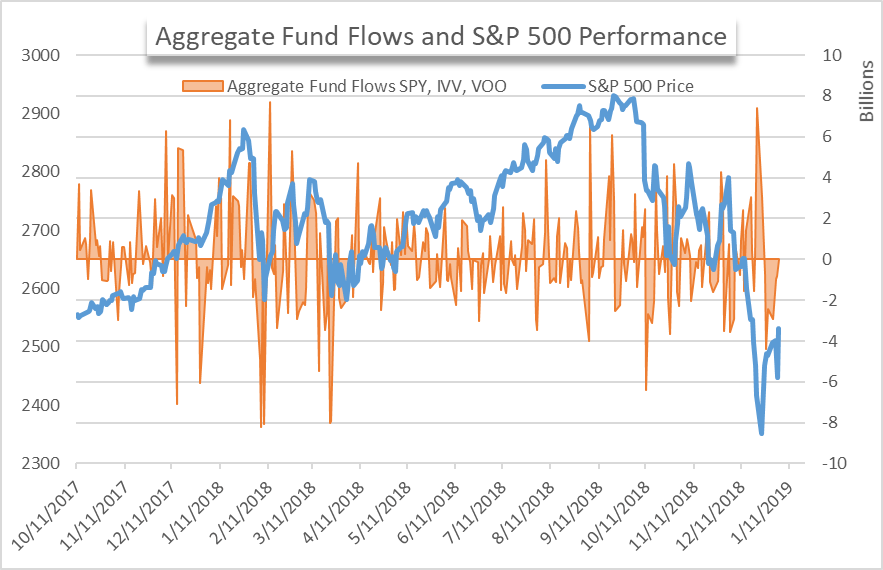
Compared to the dips for the S&P 500 in October and November, the magnitude of inflows seen during December may suggest traders see an attractive buying opportunity near the 2400 range. Upon multiple tests at the 2600 level, inflows
