

In this series we scale-back and look at the broader technical picture to gain a bit more perspective on where we are in trend. The US Dollar[1] has seemingly collapsed against the Japanese Yen[2] with price plummeting more than 8.6% of the October highs before rebounding sharply this week. Here are the key targets & invalidation levels that matter on the USD/JPY[3] weekly chart into the start of the year.
New to Forex Trading? Get started with this Free Beginners Guide[4]
USD/JPY Weekly Price Chart (log)
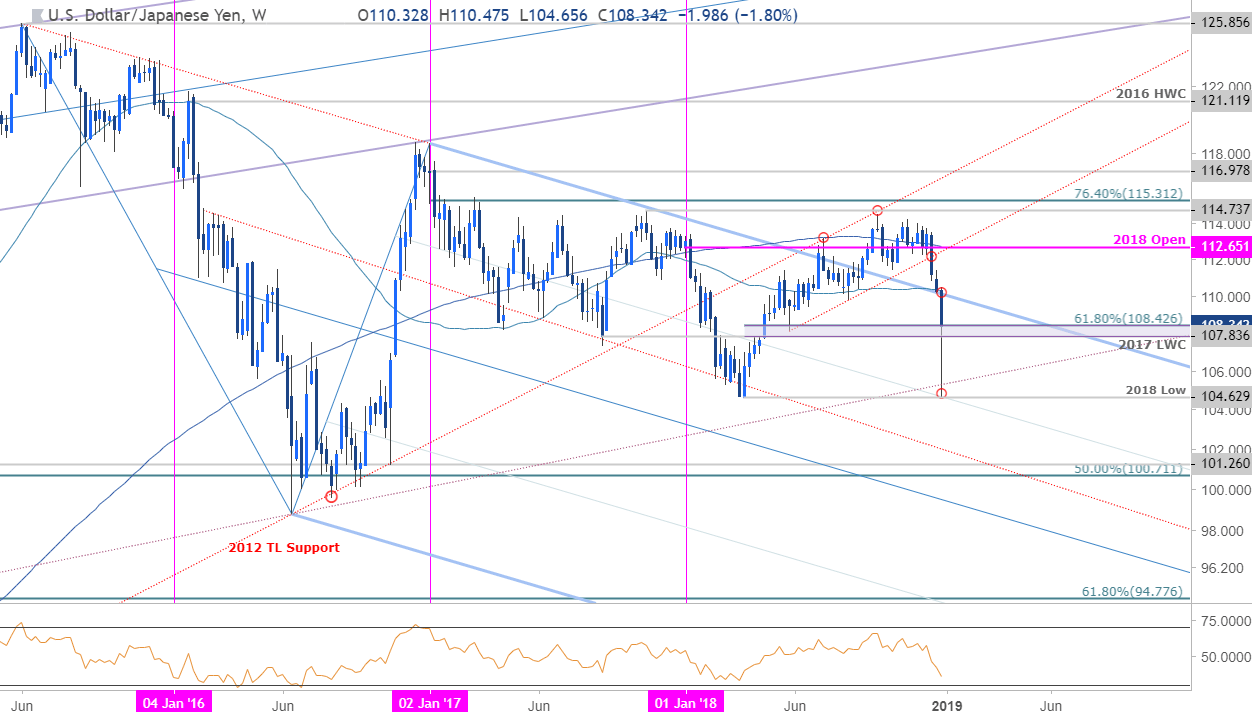
Notes: USD/JPY has nearly covered the entire 2018 range in just the past five weeks with price turning just pips from the yearly lows into the open of January trade. A sharp 3.6% rally off the weekly low takes the pair back within the confines of a key pivot zone at 107.83-108.42 – a region defined by the 2017 low-week close and the 61.8% retracement[5] of the 2018 range. This threshold has offered some major price inflections over the past few years and a close below would be needed to keep the immediate short-bias viable.
Note that price is poised to register the largest single-week average true range since 2016- there were four instances of weekly ranges equal-to-or-exceeding this extreme that year with three of the four registering key lows in price that held for weeks. This doesn’t mean price is going to rebound, but it does highlight the risk for some consolidation if USD/JPY can stabilize above this key support zone.
Initial resistance stands at the 2015 pitchfork[6] which converges on
