

In this series we scale-back and look at the broader technical picture to gain a bit more perspective on where we are in trend. EUR/USD[1] is poised to close nearly 5% lower year-to-date with the pair trading just 1.5% off the 2018 lows. For months now, we’ve been tracking a key support pivot in Euro and the focus remains on a breakout of the consolidation range which has governed price since October. Here are the key targets & invalidation levels that matter on the EUR/USD weekly chart heading into the close of the year.
New to Forex[2] Trading? Get started with this Free Beginners Guide![3]
EUR/USD Weekly Price Chart
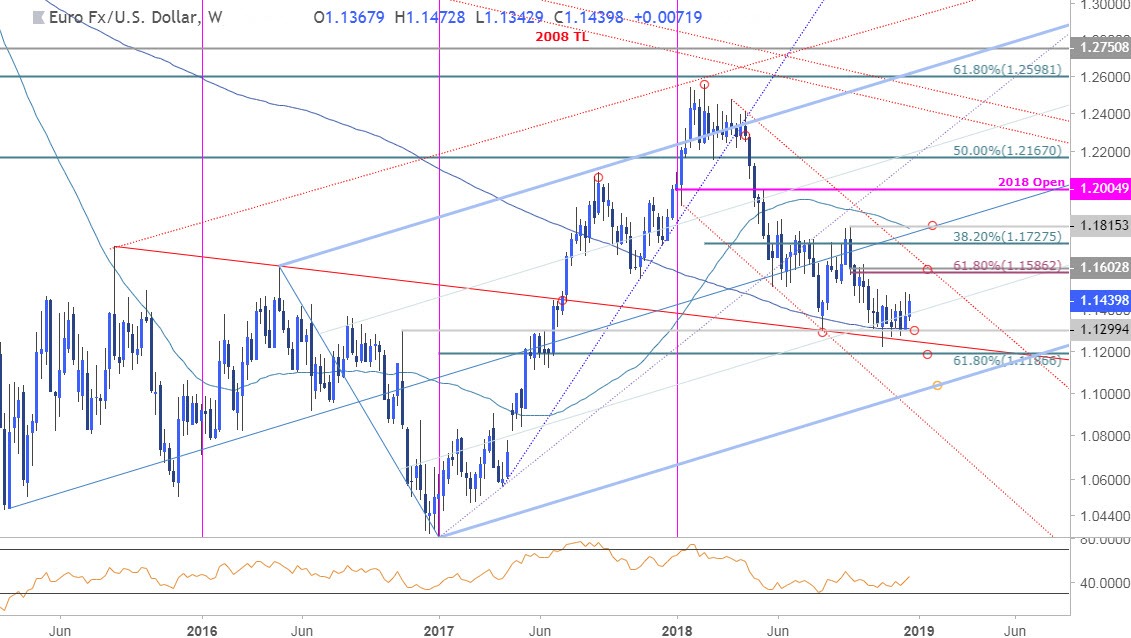
Notes: In our last EUR/USD Weekly Technical Outlook[4] we noted that price was trading just above a key support pivot with, “the broader short-bias remains at risk while above this level - for now, I’ll be on the lookout for possible price exhaustion on a move towards 1.13 again.” Nearly three weeks later an Euro has continued to respect this threshold on a weekly close basis with price now testing the monthly range highs into the close of the year.
Key weekly resistance stands at 1.1586-1.16030 where the March trendline converges on the September outside-weekly reversal close (also the high week close) and the 61.8% retracement[5]. A breach / close above this threshold is needed to suggest that a more significant low is in place with such a scenario targeting subsequent topside objectives at 1.1727 and the median-line / 52-week moving average / September high at 1.1800/15.
