

The Australian Dollar is down more than 2.7% against the greenback[1] month-to-date with price trading just above confluence technical support into the weekly open. These are the updated targets and invalidation levels that matter on the AUD[2]/USD charts heading into FOMC[3] interest rate decision. Review this week’s Strategy Webinar[4] for an in-depth breakdown of this setup and more.
New to Forex Trading? Get started with this Free Beginners Guide[5]
AUD/USD Daily Price Chart
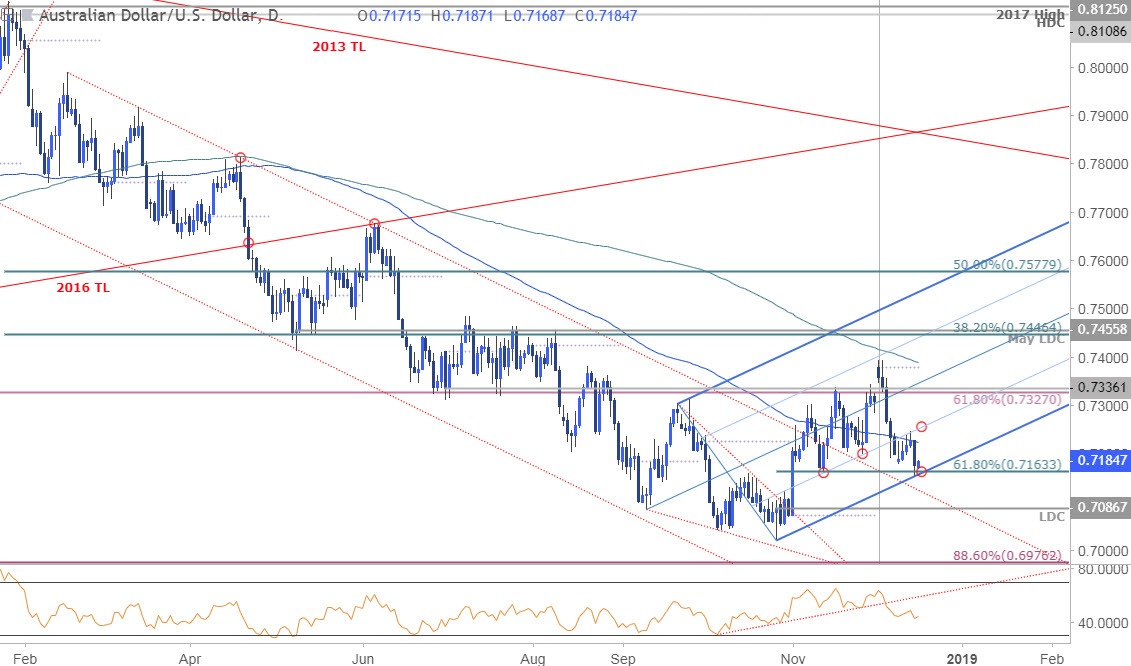
Technical Outlook: In my latest AUD/USD Weekly Technical Outlook[6] we noted that Aussie was, “carving its monthly opening range just below technical resistance an leaves price vulnerable to further losses while below 7385. From a trading standpoint, look for a reaction on a move into Fibonacci support at 7163,” – where the 61.8% retracement of the late-October advance converges on pitchfork[7] support extending off the yearly lows. Price registered a low at 7151 last week before rebounding and the focus is on reaction off this confluence support zone heading into FOMC on Wednesday.
A break below this threshold exposes former channel resistance (currently ~7120s) and the yearly low-day close at 7087. Initial resistance stands with the 100-day moving average with a breach above the 25% line around ~7260s to mark resumption of the broader uptrend. Critical resistance steady at 7327/36.
Learn how to Trade with Confidence in our Free Trading Guide[8]
AUD/USD 240min Price Chart
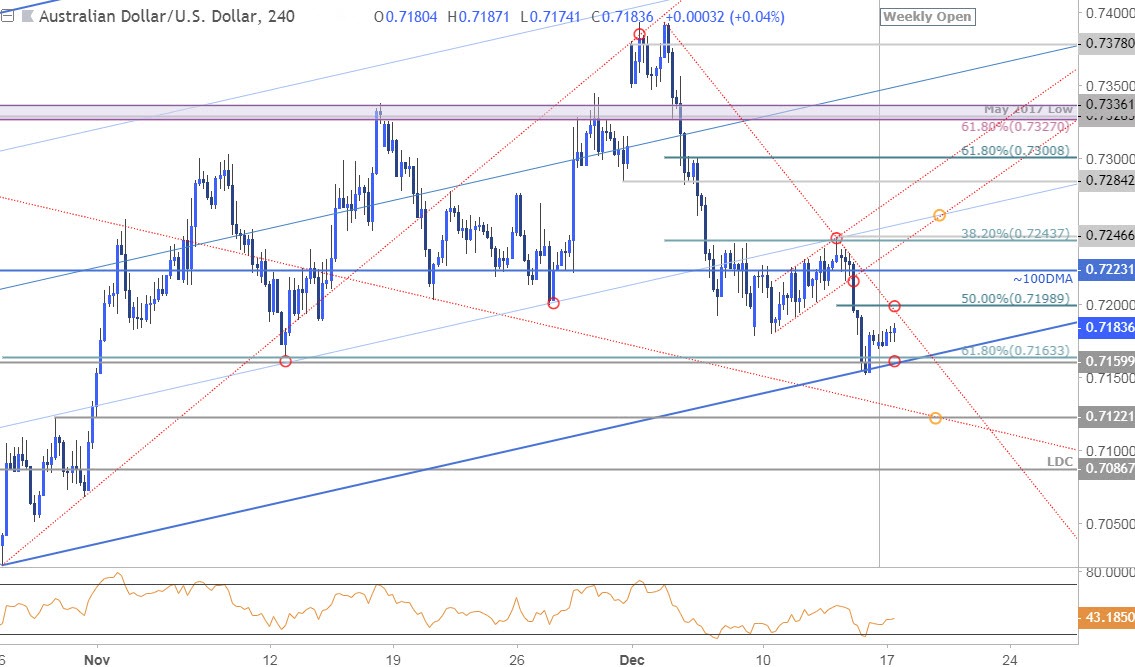
Notes: A closer look at price action highlights the near-term support confluence around 7160/63- IF
