The Australian Dollar[1] has fallen more than 1.5% against the US Dollar[2] from the recent three-month highs after failing to hold above yearly slope resistance. We’re looking for a low near upcoming support targets to identify whether this is just a correction or the resumption of the broader downtrend. These are the updated targets and invalidation levels that matter on the AUD/USD charts. Review this week’s Strategy Webinar[3] for an in-depth breakdown of this setup and more.
New to Forex Trading? Get started with this Free Beginners Guide[4]
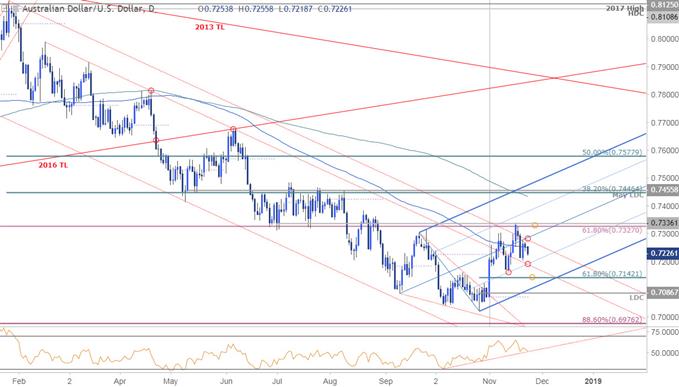
AUD/USD Daily Price Chart

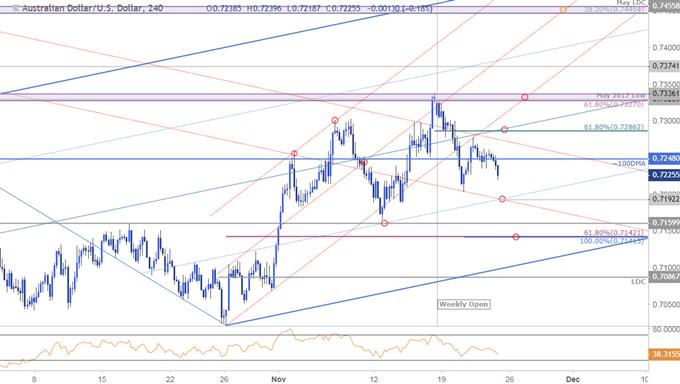
Technical Outlook: In my previous AUD/USD Price Outlook[5] we noted that Aussie had, “broken above multi-month slope resistance and although the broader outlook remains constructive, the advance may be vulnerable near-term while below 7327/36.” Price registered a high at 7338 last week before turning over sharply with the pullback breaking back below the January parallel.
Interim support rests with the highlighted trendline confluence around ~7190s with broader focus higher while above 7142. Ultimately, a break below the yearly low-day close at 7087 would be needed to mark resumption of the broader downtrend. Initial resistance stands with the median-line around ~7280s with critical resistance steady at 7327/36- a breach / close above this threshold is needed to validate the reversal and would suggest that a more significant low was put in last month. Note the pending RSI support trigger[6] extending off the October lows.
Learn how to Trade with Confidence in our Free Trading Guide[7]
AUD/USD 240min Price Chart

Notes: A closer


