

Gold rebounded from technical support this week with the rally now testing a critical inflection zone in price. These are the updated targets and invalidation levels that matter on the XAU/USD charts. Review this week’s Strategy Webinar[1] for an in-depth breakdown of this setup and more.
New to Gold Trading? Get started with this Free How to Trade Gold -Beginners Guide[2]
Gold Daily Price Chart (XAU/USD)
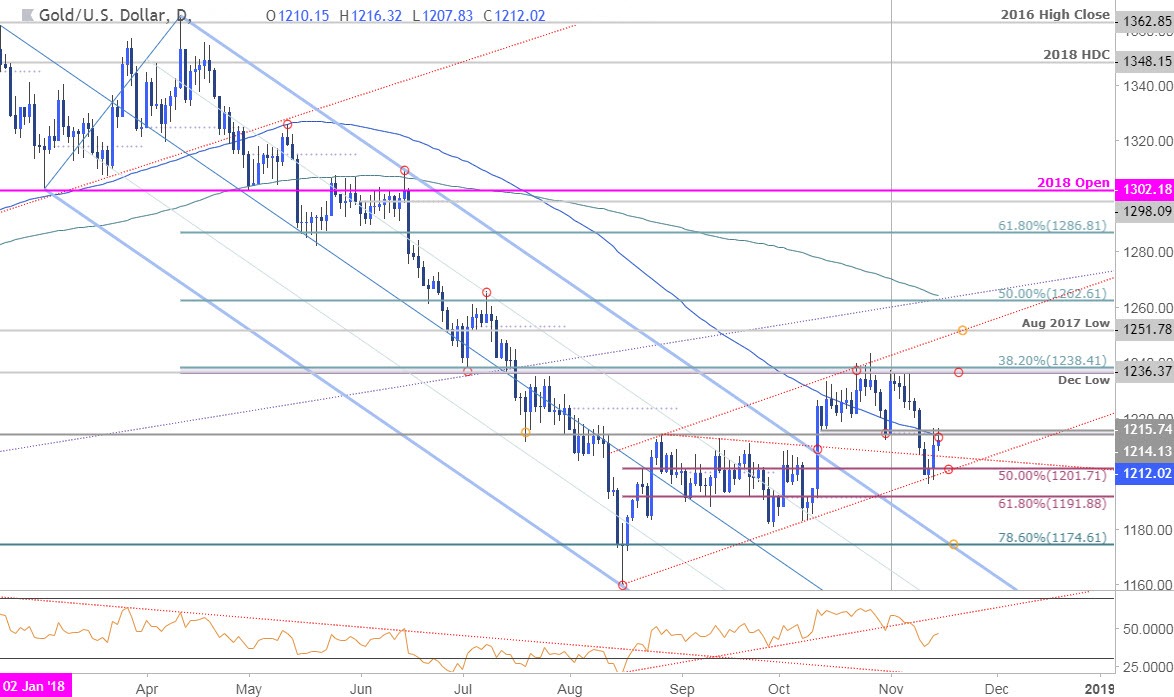
Technical Outlook: In our latest Gold Weekly Technical Outlook[3] we stated that, “Put simply, IF gold prices[4] are going to rebound, next week would be the time- and the support zone we’re trading into would be the place.” The sell-off got a little deeper than expected with price registering a low at 1196 before rebounding with the recovery now testing key near-term, resistance at 1214/16 – a region defined by the November open, the May 2017 low and the 100-day moving average. Note that this pivot zone has fueled numerous price inflections over the past few months and a breach / close above would be needed to suggest a more significant low is in place.
A slight adjustment to our channel keeps the focus on 1201 for support (also the monthly low-day close) – a break below this level risks substantial losses for the yellow metal with such a scenario targeting subsequent support objectives at 1192 an 1180.
Why does the average trader lose? Avoid these Mistakes in your trading[5]
Gold 240min Price Chart (XAU/USD)
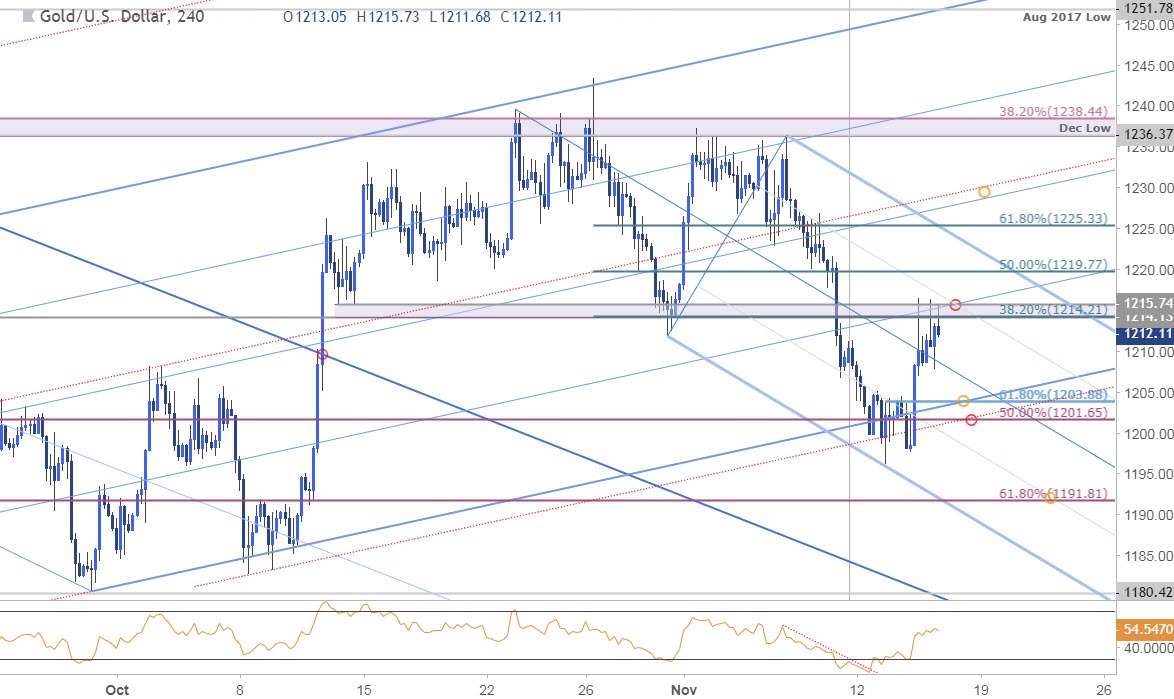
Notes: A closer look at price action shows gold rebounding off the lower bounds of the ascending
