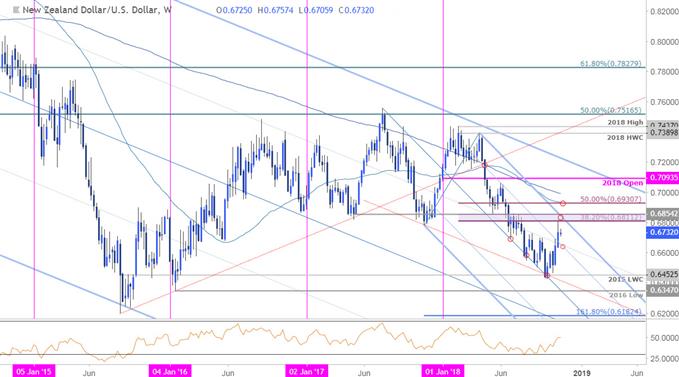
In this series we scale-back and take a look at the broader technical picture to gain a bit more perspective on where we are in trend. The New Zealand Dollar[1] has rallied nearly 5% off the yearly lows with price now targeting critical down-trend resistance. Here are the key targets & invalidation levels that matter on the NZD/USD[2] weekly chart. Review this week’s Strategy Webinar[3] for an in-depth breakdown of this setup and more.
New to Forex Trading? Get started with this Free Beginners Guide[4]
NZD/USD Weekly Price Chart

Notes: In last month’s NZD/USD Weekly Technical Perspective[5] we highlighted a critical support confluence at 6453/88 – a region defined by the 2015 low-week close, the sliding parallel of the broader descending slope (red) and the median-line of the pitchfork[6] extending off the 2017/2018 highs. Price registered a low at 6424 the following week before reversing sharply higher with the advance now testing a critical resistance range at 6811/54 where the 38.2% retracement of the yearly range converges on the 2017 low-week close and down-slope resistance (blue).
The focus is on a reaction off this key zone with the immediate long-bias at risk while below. Interim support rests at the trendline confluence around ~6640s backed by the low-week close at 6506. Ultimately a break below 6453 would be needed to mark resumption of the broader downtrend targeting the 2016 lows at 6347. A topside breach / close above this formation would suggest a more significant low is in place with such scenario targeting


