

The Australian Dollar[1] is up nearly 4% off the yearly lows with the rally breaking through yearly down-trend resistance this week. Here are the updated targets and invalidation levels that matter on the AUD/USD[2] charts this week. Review this week’s Strategy Webinar[3] for an in-depth breakdown of this setup and more.
New to Forex Trading? Get started with this Free Beginners Guide[4]
AUD/USD Daily Price Chart
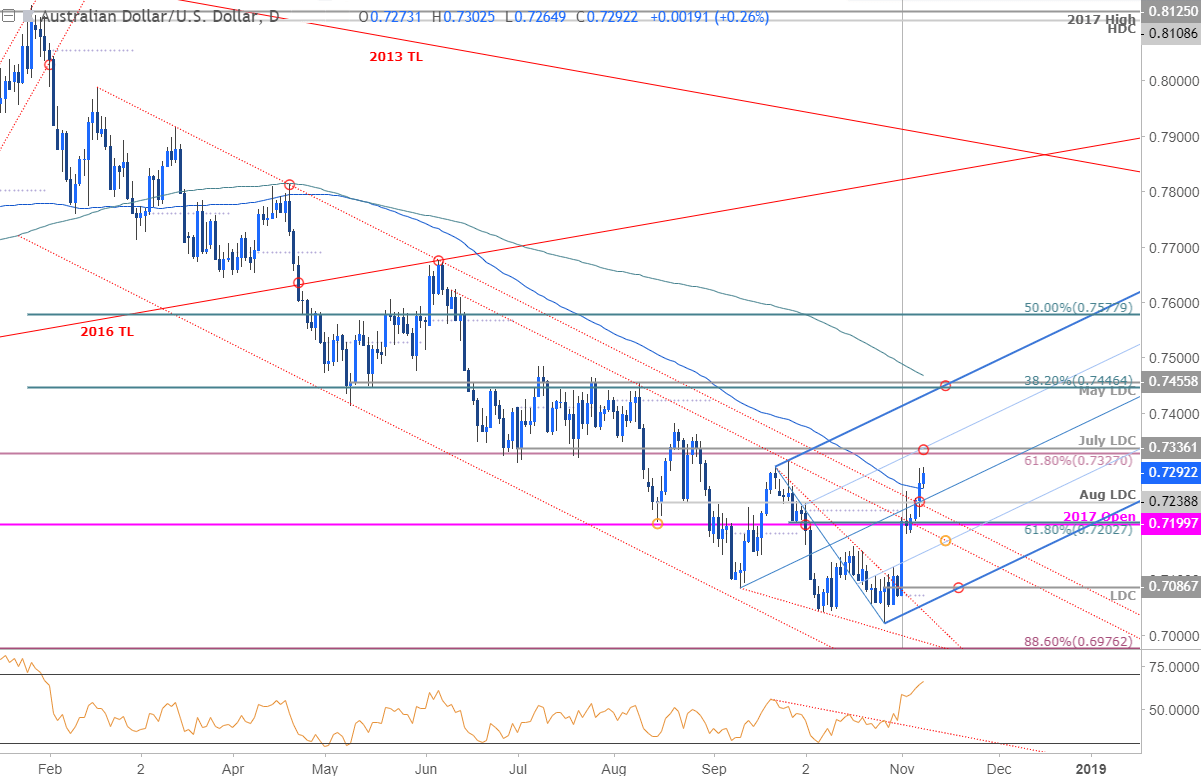
Technical Outlook: In my latest AUD/USD Weekly Technical Outlook[5] we highlighted a multi-month resistance slope in price with our ‘bottom line’ favoring the long-side while above the low-day close at 7087. A breach above confluence resistance at 7239 yesterday has clears the way for a larger advance with our focus higher in Aussie while above the trendline confluence around ~7160 (yellow).
Initial daily resistance stands at 7327/36 with a breach / close above the upper 50-line targeting a more significant zone at 7446/56 where the 38.2% retracement of the yearly range and the May low-day close converge on pitchfork[6] resistance (note the 200-day moving average just higher).
Learn how to Trade with Confidence in our Free Trading Guide[7]
AUD/USD 240min Price Chart
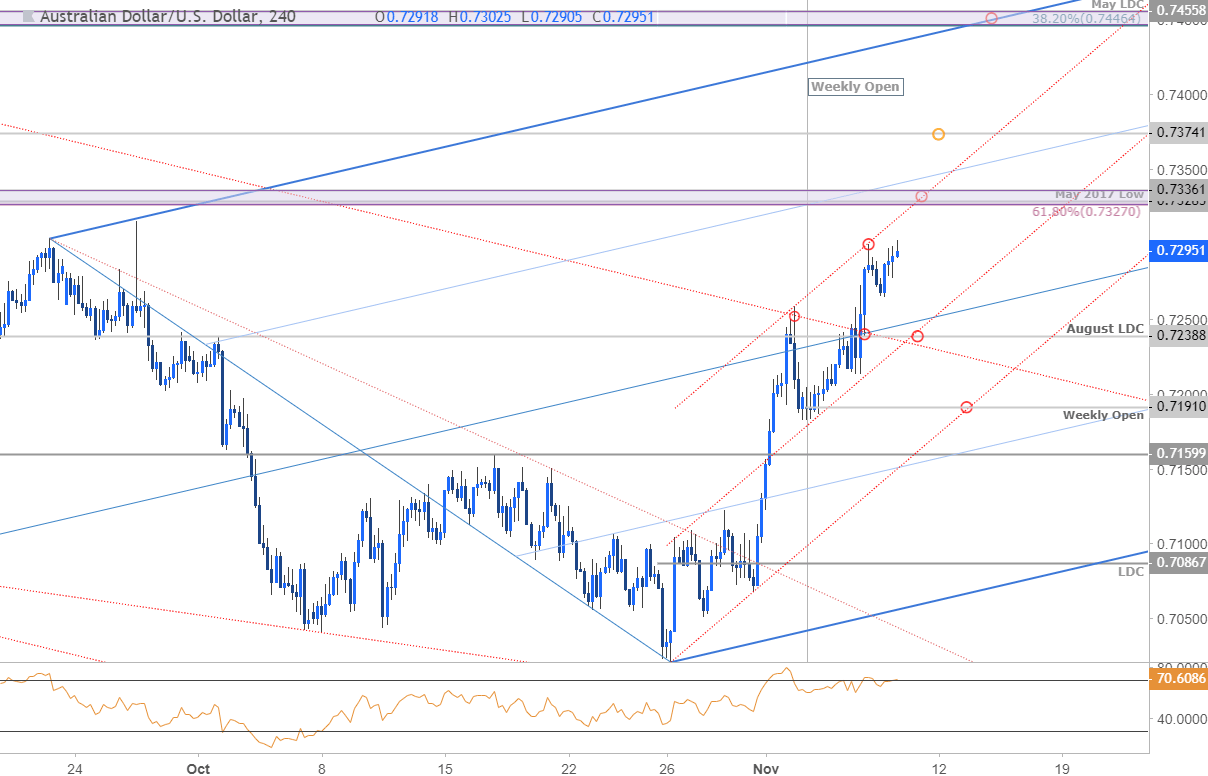
Notes: A closer look at price action shows AUD/USD trading within the confines of a slope series originating off the late-October lows (red). Initial support rests at back at 7239 with our near-term focus higher while above the lower parallel / weekly open support at 7191.A break below 7160 would beneeded to suggest a more significant high is in
