

The New Zealand Dollar[1] has continued to trade just below multi-month slope resistance with the initial October opening-range in focus heading into the close. Here are the updated targets and invalidation levels that matter on the NZD/USD charts. Review this week’s Strategy Webinar[2] for an in-depth breakdown of this setup and more.
New to Forex Trading? Get started with this Free Beginners Guide[3]
NZD/USD Daily Price Chart
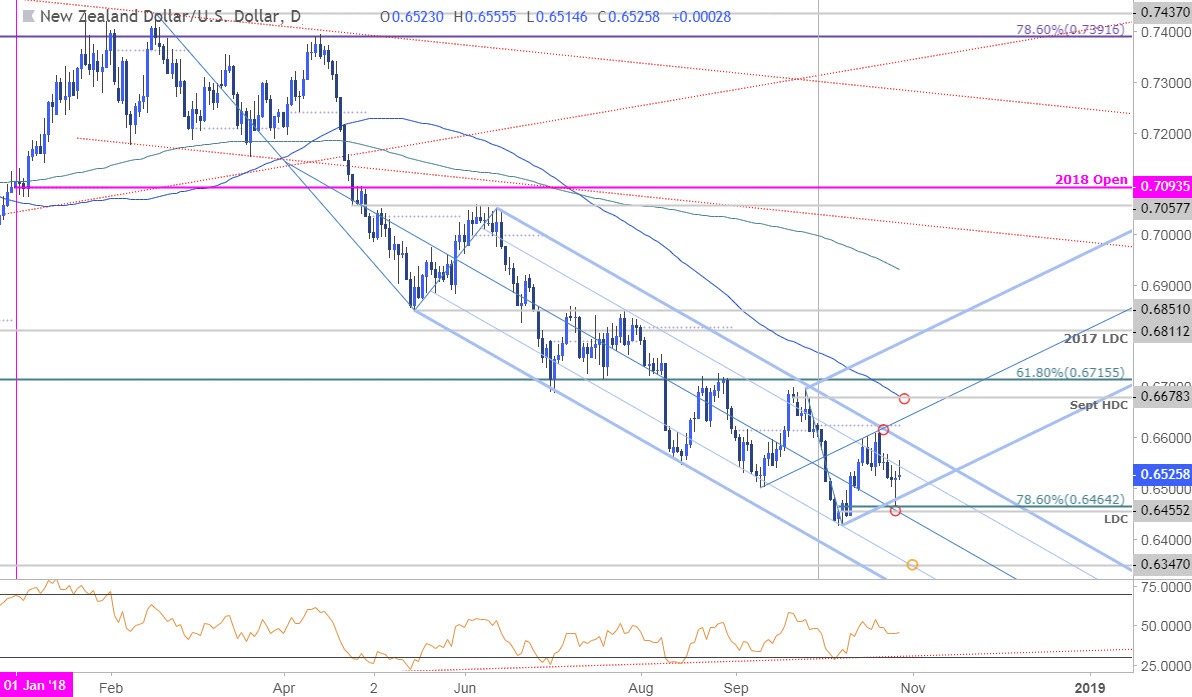
Technical Outlook: In my Weekly Technical Outlook on the New Zealand Dollar[4], our ‘bottom line’ noted that Kiwi was, “trading just above key confluence support at 6453/88 and IF prices are going to post some sort of near-term recovery this would be the spot.” Kiwi registered a low at 6424 just two days later before reversing sharply back toward the upper parallel of the pitchfork[5] formation we’ve been tracking off the yearly highs.
Despite the volatility, NZD/USD continues to trade within the confines of the October opening-range[6] and we’ll be looking for the break to offer further guidance on our medium-term directional bias. Critical daily support rests at 6453/65 – a region defined by the 2015 low-week close, the yearly low-day close and the 78.6% retracement of the October advance. A topside breach of the descending pitchfork is needed to suggest a more significant low is in place.
Learn how to Trade with Confidence in our Free Trading Guide[7]
NZD/USD 240min Price Chart
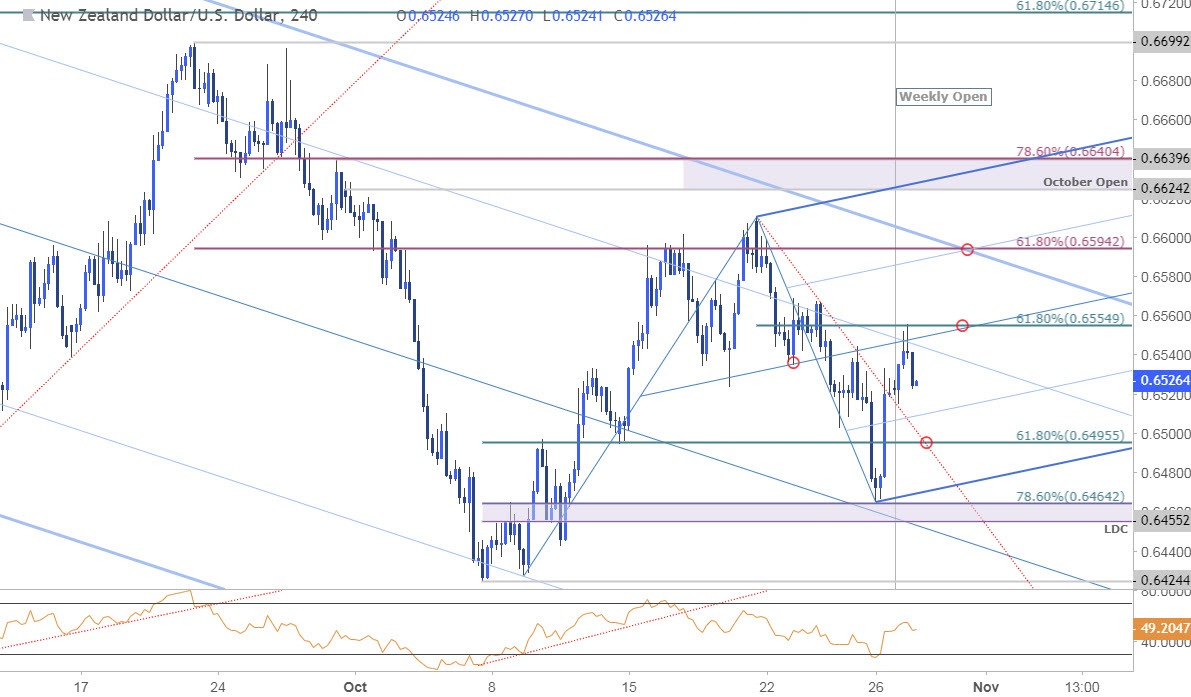
Notes: I’m working with a slightly different slope on the intraday chart but the same levels are reflected. Looking for support ahead of 6496 if
