

In this series we scale-back and take a look at the broader technical picture to gain a bit more perspective on where we are in trend. The US Dollar[1] is up nearly 3% from the September lows with the index now approaching the yearly highs into the close of the month. Here are the key targets & invalidation levels that matter on the DXY[2] weekly chart. Review this week’s Strategy Webinar[3] for an in-depth breakdown of this setup and more.
New to Forex Trading? Get started with this Free Beginners Guide[4]
DXY Weekly Price Chart
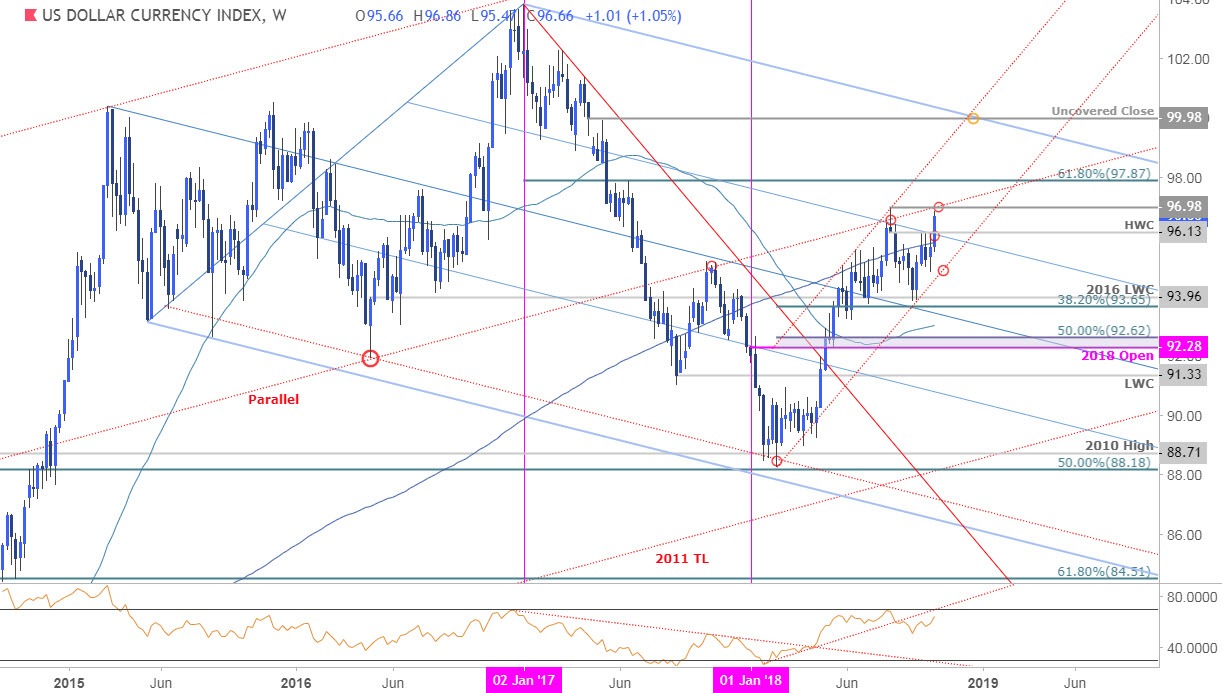
Notes: Into the start of October trade we noted that the ‘battle lines’ were drawn in the US Dollar Index[5] as price approached confluence resistance at high-week close at 96.13, “a close above this threshold would be needed to keep the long-bias in play with such a scenario targeting parallel resistance (red) / yearly highs at 96.98.” DXY carved out a clean monthly opening range for nearly three-weeks before breaching higher with the advance now targeting the this key threshold.
A weekly close above would be needed to keep the immediate long-bias viable with such a scenario targeting the 61.8% retracements of the 2017 decline at 97.87. Key longer-term resistance is eyed at the April 2017 uncovered close at 99.98- note that a parallel of the yearly slope (red) converges on this region into the start of December trade. Initial support now rests back with the 200-week moving average around ~95.75 with a bullish invalidation now raised to the 95-handle / channel
