

Crude prices have plummeted more than 13% from the yearly / monthly high with the decline now approaching the first major support hurdle. Here are the updated targets and invalidation levels that matter on the Crude Oil[1] (USOil) charts. Review this week’s Strategy Webinar[2] for an in-depth breakdown of this setup and more.
New to Oil Trading? Get started with this Free Guide on How to Trade Crude Oil[3]
Crude Oil Daily Price Chart
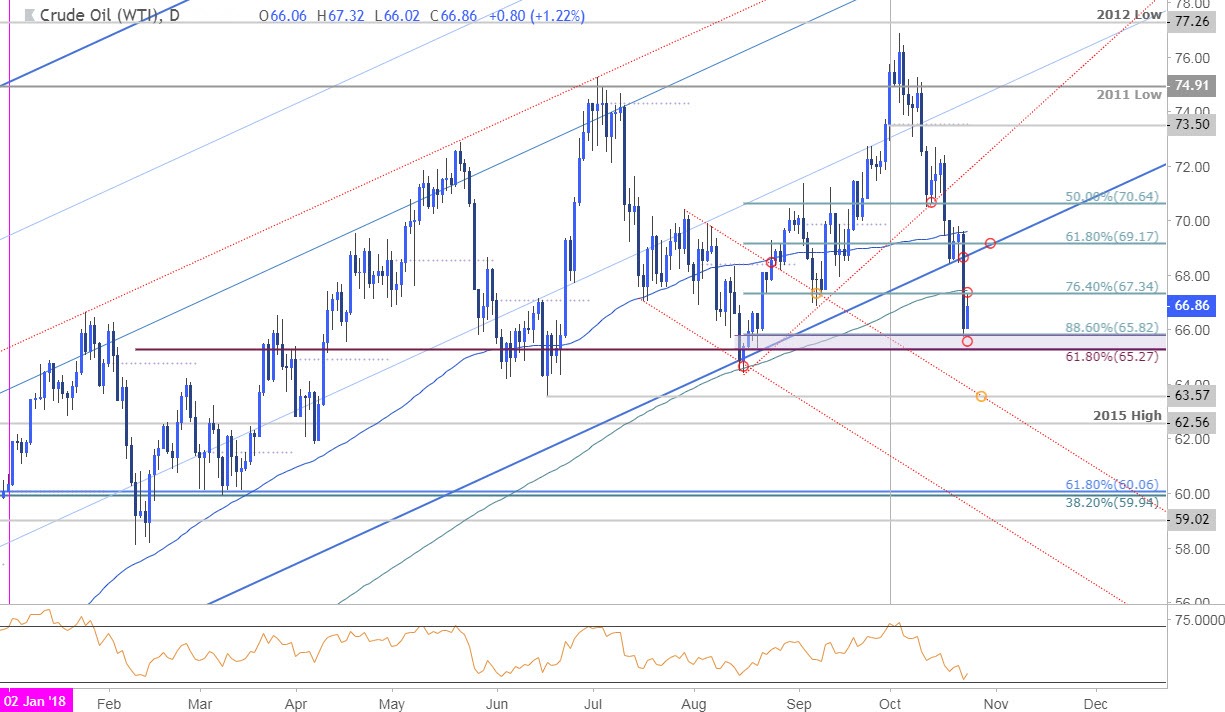
Technical Outlook: In our latest Crude Oil Weekly Technical Outlook[4], we noted expectations for a reaction as price was approaching multi-year uptrend support. Yesterday’s sell-off saw prices accelerate through this key zone with the decline taking out targets into the first major support hurdle at 65.27/82. This region is defined by the 88.6% retracement of the August advance, the June & August low-day reversal closes and the 61.8% retracement of the yearly range. Initial resistance now stands with the 200-day moving average at 67.34/45 with bearish invalidation now lowered to 69.17.
Crude Oil 240 Price Chart
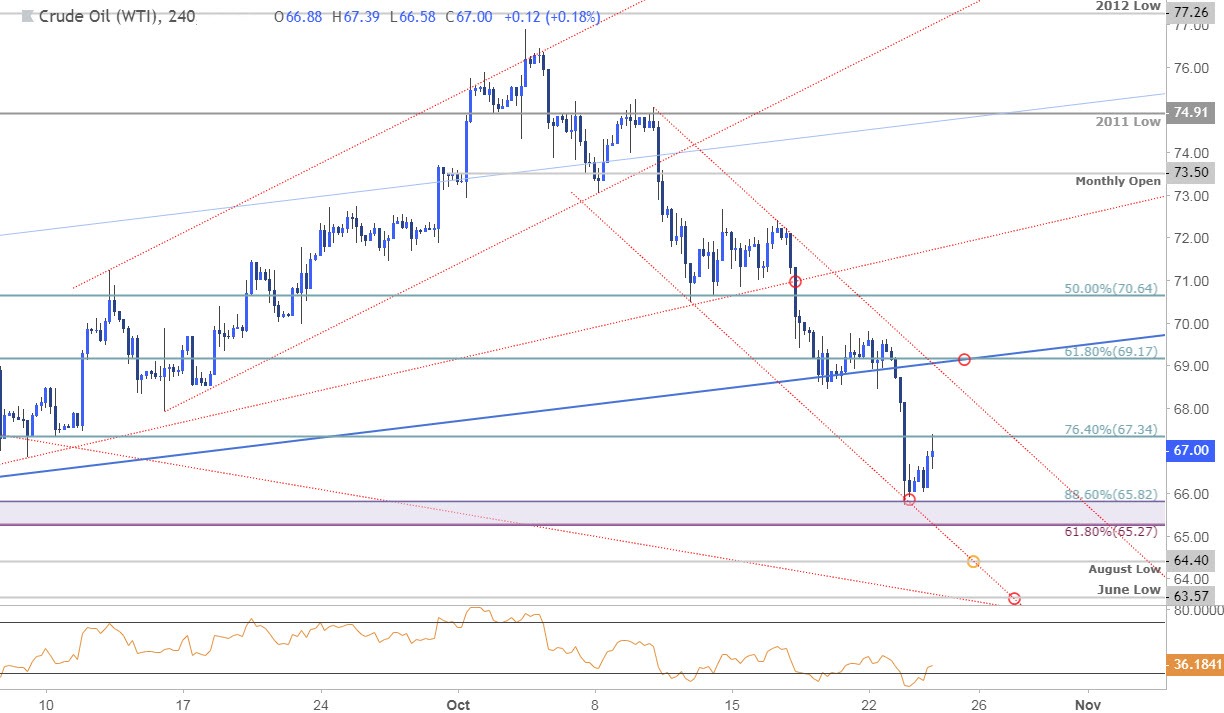
Notes: A closer look at price action shows crude trading within the confines of near-term descending channel formation with price rebounding off confluence support today at the 65.27/82 pivot zone. A break / close below this level keeps the focus lower with such a scenario targeting subsequent support objectives at 64.40 and the June low at 63.57.
Even the most seasoned traders need a reminder every now and then-Avoid these Mistakes in your trading[5]
Bottom line: Crude prices are testing a key technical support pivot with the immediate
