

The Canadian Dollar[1] is has plummeted more than 1.4% month-to-date against the greenback with USD/CAD[2] trading just below confluence resistance ahead of the Bank of Canada[3] interest rate decision tomorrow. Here are the updated targets and invalidation levels that matter on the USD/CAD charts. Review this week’s Strategy Webinar[4] for an in-depth breakdown of this setup and more.
USD/CAD Daily Price Chart

Technical Outlook: In our latest USD/CAD Weekly Technical Outlook[5], we highlighted a, “critical resistance barrier at 1.3130/55- a region defined by the yearly high-week reversal close, the 61.8% retracement of the June decline and parallel resistance (red).” This key level remains in focus heading into tomorrow’s central bank rate decision.
Note that daily RSI has held sub-60 since the yearly highs registered in June- watch this closely into the close of trade tomorrow. A breach in momentum alongside a rally surpassing 1.3155 would be needed to validate the breakout with such a scenario targeting subsequent objectives at 1.3206 and 1.3257.
New to Forex Trading? Get started with this Free Beginners Guide[6]
USD/CAD 240 Price Chart
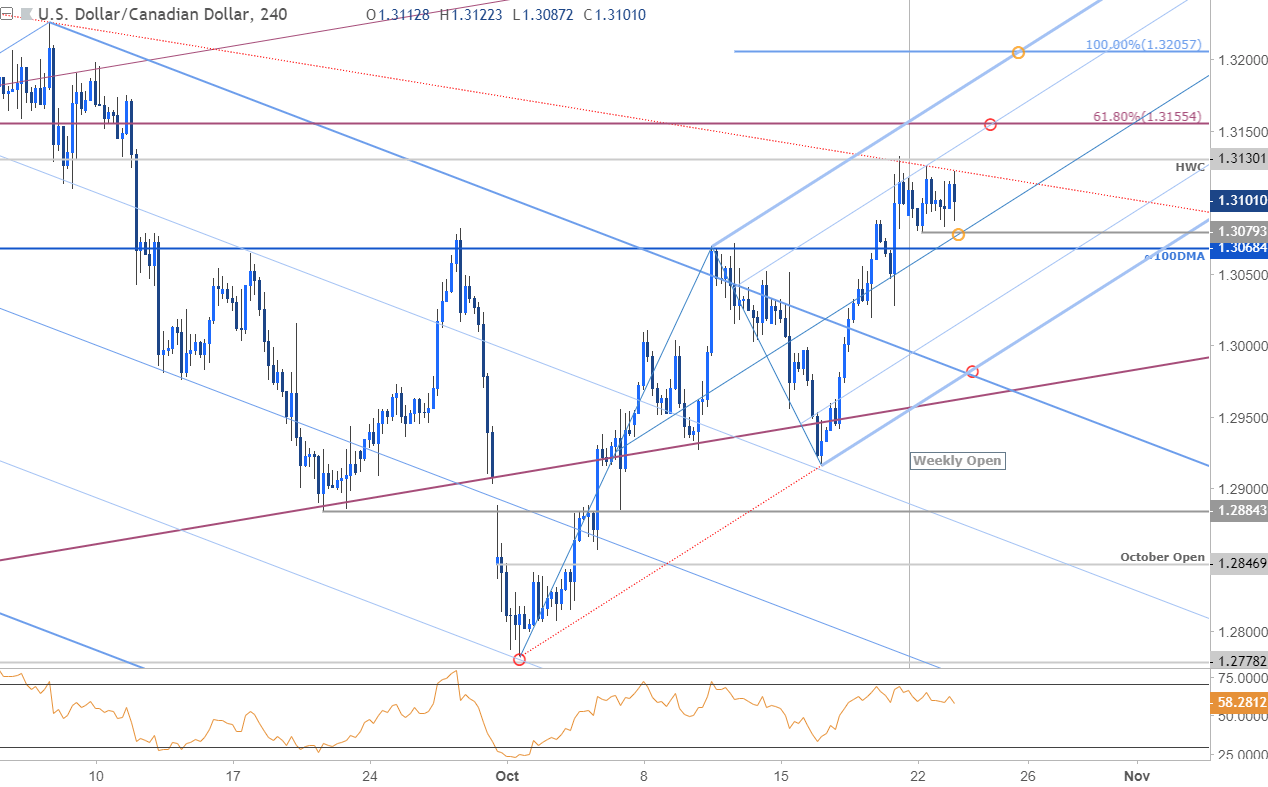
Notes: A closer look at price action shows the USD/CAD trading within the confines of an ascending pitchfork formation[7] extending off the monthly lows with the median-line highlighting interim support at 1.3068/80 (weekly opening-range low & 100-day moving average. A break below this level shifts the focus towards the lower parallels, currently ~1.3020 & 1.2980s- look for a bigger reaction there. Broader bullish invalidation rests at 1.2957.
Even the
