

In this series we scale-back and take a look at the broader technical picture to gain a bit more perspective on where we are in trend. The Canadian Dollar[1] has been under considerable pressure for the past three weeks (USD/CAD higher more-than 2% month-to-date) with price now testing a critical resistance confluence ahead of the Bank of Canada rate decision on Wednesday. Here are the key targets & invalidation levels that matter on the USD/CAD[2] weekly chart. Review this week’s Strategy Webinar[3] for an in-depth breakdown of this setup and more.
New to Forex Trading? Get started with this Free Beginners Guide[4]
USD/CAD Weekly Price Chart
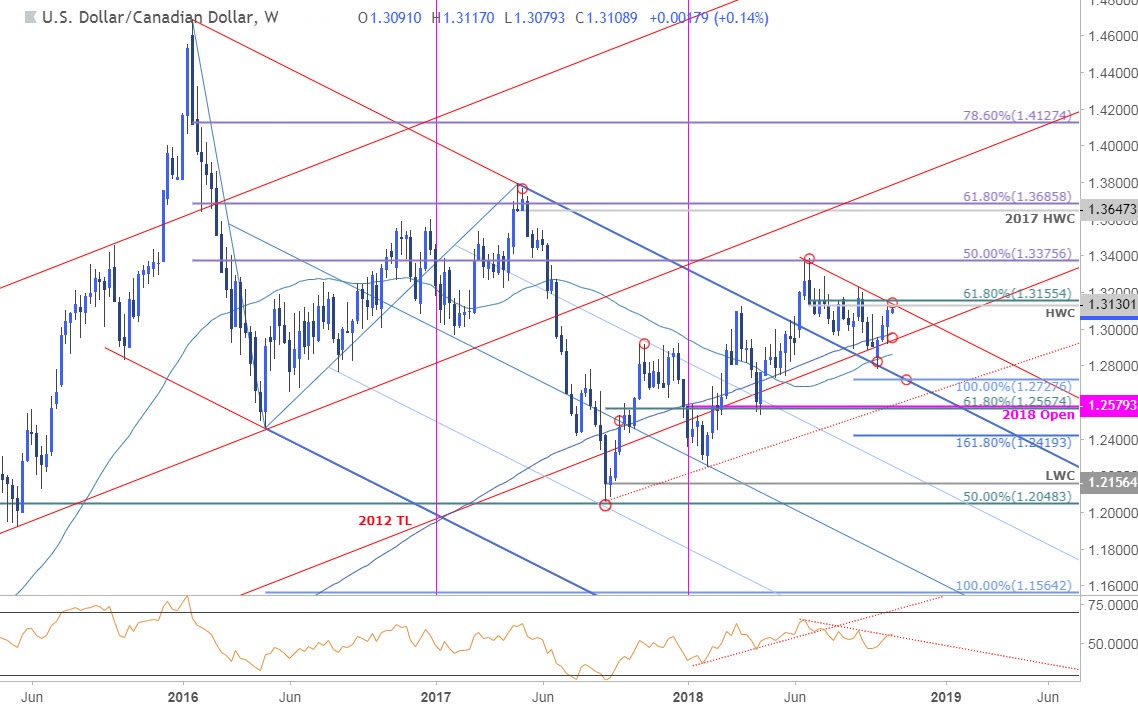
Notes: USD/CAD broke above 2016 pitchfork[5]resistance back in June with price rebounding off this same slope into the start of October trade. Initially, the move looked like a breakdown in price[6] – we were wrong! The subsequent recovery fueled a three-week rally with USD/CAD now approaching a critical resistance barrier at 1.3130/55- a region defined by the yearly high-week reversal close, the 61.8% retracement of the June decline and parallel resistance (red). Note that weekly RSI is also testing a resistance trigger extending off the yearly highs in momentum.
A breach / close above this threshold is needed to keep the long-bias viable with such a scenario targeting the 50% retracement[7] of the 2016 decline at 1.3376 backed by 1.3647/86. Initial support rest with the monthly low-week close / 200-week moving average at ~1.2939/70 backed by the 52-week at ~1.2860s and a more significant confluence at
