

The British Pound continues to trade within the weekly opening-range heading into the EU/UK Brexit negotiations[1]. Here are the updated targets and invalidation levels that matter on the GBP/USD[2] charts this week. Review this week’s Strategy Webinar[3] for an in-depth breakdown of this setup and more.
GBP/USD Daily Price Chart

Technical Outlook: GBP/USD has been trading within the confines of this descending pitchfork[4] formation extending off the yearly highs – we highlighted the threat of a larger pullback in the British Pound last week[5] as price was carving out an outside-day reversal off the 75% slope line. Note that daily RSI failed at the 60-threshold and further highlights the near-term risk for steeper losses here.
That said, the broader outlook remains weighted to the topside while above the August trendline with initial daily support eyed at the 100-day moving average (currently ~1.31) backed by the October open at 1.3031- we’re on the lookout for downside exhaustion off one of these levels. A topside breach of the monthly range highs looks to challenge more significant resistance at the confluence of the December low, the September highs and the 38.2% retracement[6] at 1.3302/17 and the upper parallel around ~1.3360s.
New to Forex Trading? Get started with this Free Beginners Guide[7]
GBP/USD 240min Price Chart
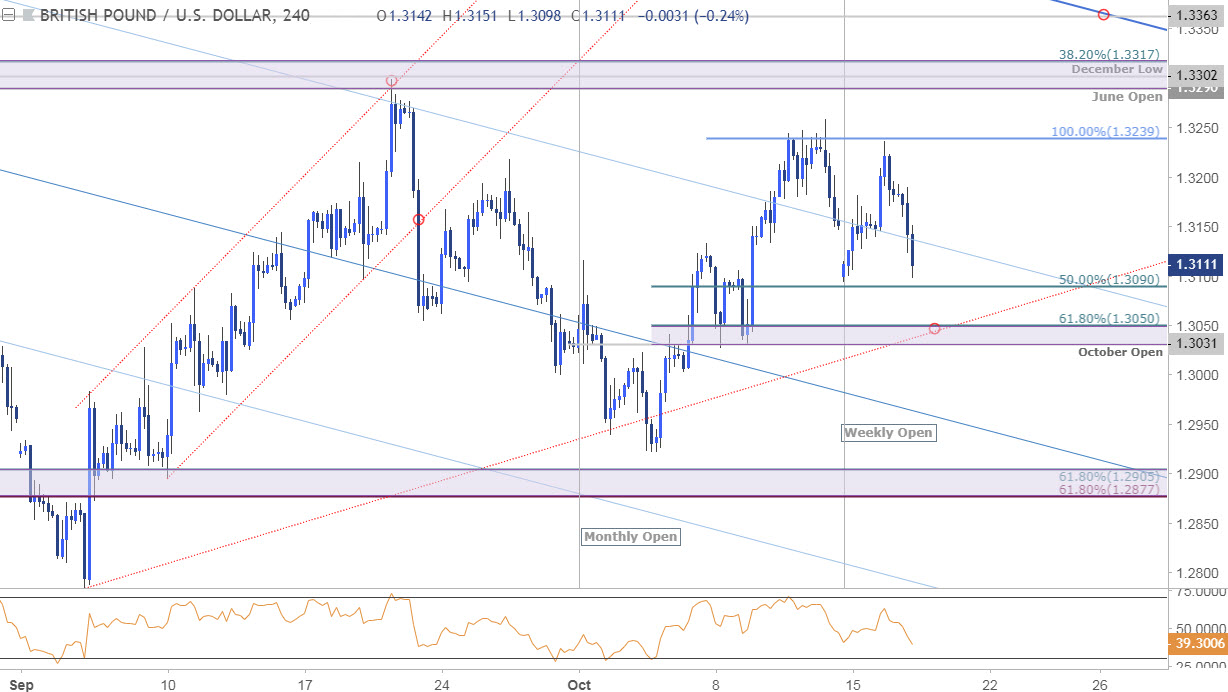
Notes: A closer look at near-term price action shows Sterling holding a within a clean weekly opening-range[8] just below the 100% extension of the monthly advance at 1.3239. A break below 1.3090 targets
